dbMonitor
To extend monitoring capabilities of our data access products there is an additional tool called dbMonitor. It is easy-to-use tool to provide visual monitoring of your database applications.
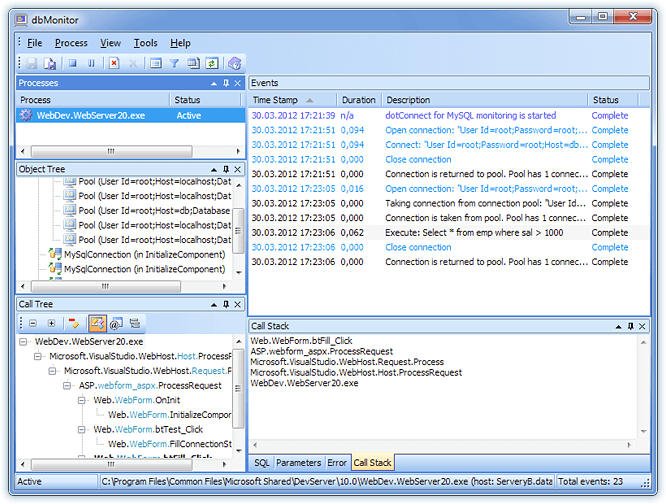
dbMonitor performs per-component tracing of database events such as commit, rollback, SQL statement execute, creating and destroying components, connection pooling events etc.
Key Features
- Call stack information for events (only for monitoring ADO .NET providers ) [New]
- Filtering events by type, SQL, description, status, duration, and other parameters [New]
- Call Tree window for displaying merged call stacks and filtering events by calling method (only for monitoring ADO .NET providers) [New]
- Object Tree window for filtering events by calling object [New]
- Remote debugging [New]
- Multiple client processes tracing
- SQL parameter and error tracing
- Sorting events by description, timestamp, duration, and event status [New]
- Unicode support [New]
dbMonitor is intended to hamper application being monitored as less as possible.
General dbMonitor View
New version of dbMonitor is compatible with the latest versions of dotConnect data providers. Use older dbMonitor version for other products. See Compatibility for more information.