T-SQL Code Analyzer Tool
dbForge Studio for SQL Server provides a fast and automated way
to improve the quality of your code. T-SQL Analyzer helps you identify and eliminate potential design and naming issues
and avoid performance pitfalls by thoroughly analyzing your T-SQL code.
With T-SQL Analyzer, you can:
-
Detect potential defects in SQL statements
- Identify discontinued or deprecated T-SQL keywords or syntax
-
Check T-SQL code for compliance with best practices
- Customize code analysis profiles to fit your specific needs
- View recommendations to enhance code readability and maintainability
Analyzing code
You can analyze your code in the following way:
-
Open the database instance containing the code you want to analyze.
-
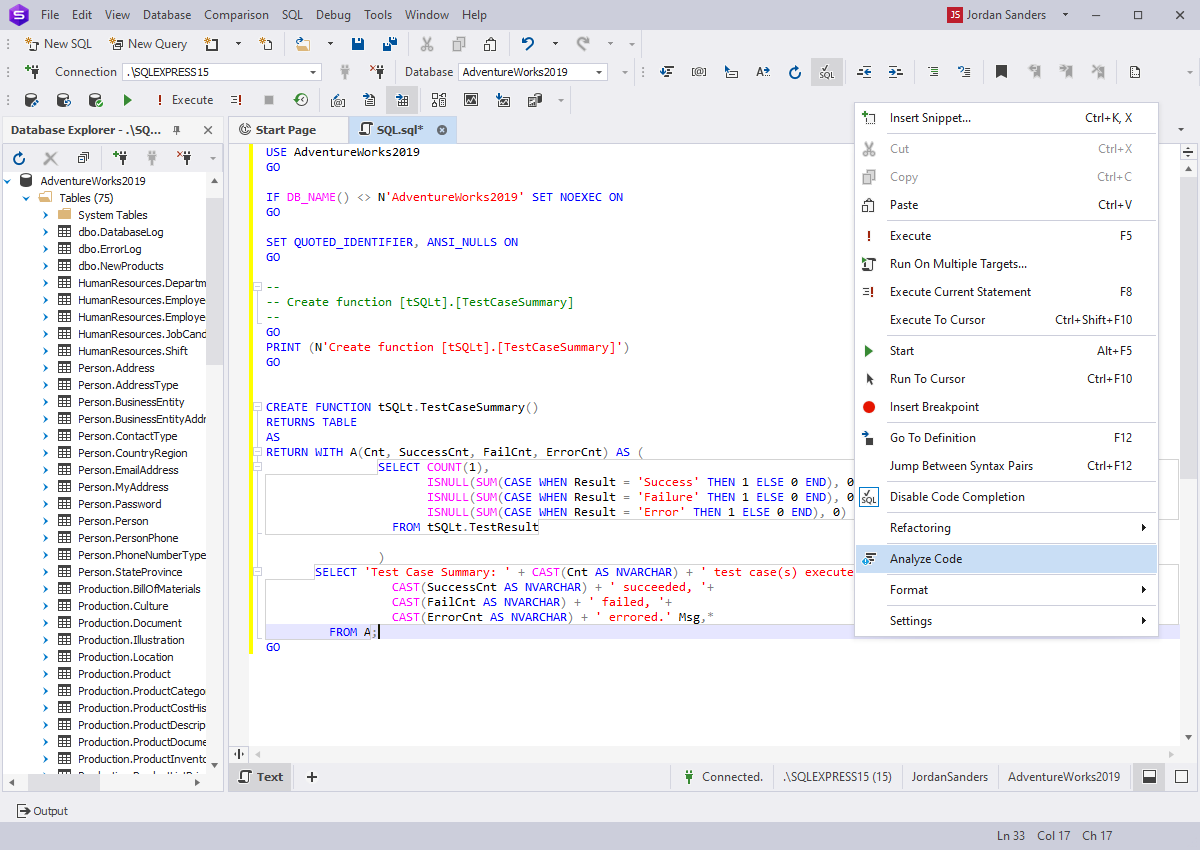
Right-click anywhere on the document and select Analyze Code from the shortcut menu. Alternatively, on the ribbon, select SQL > Analyze Code.
Viewing the error list
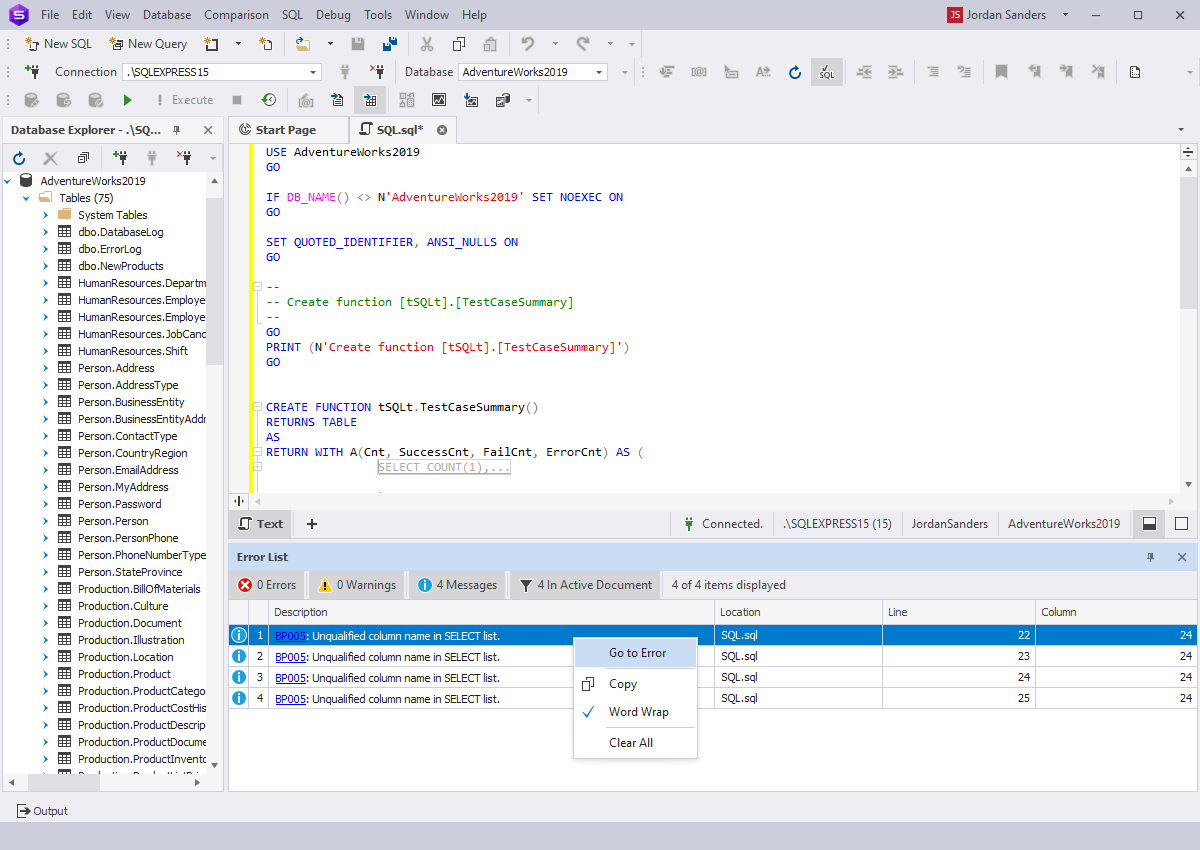
When analyzing code in the database instance, any warnings and errors will be displayed in the Error List.
To locate the error or warning on the code, right-click it and select Go to Error from the shortcut menu. For more information on each entry,
click the error code highlighted in blue, which will direct you to the relevant page in our documentation.
Customizing code analysis rules
T-SQL Analyzer comes with a default profile containing all the code analysis rules. The tool also allows you to create a custom T-SQL Analyzer profile
or change a set of the code analysis profile rules.
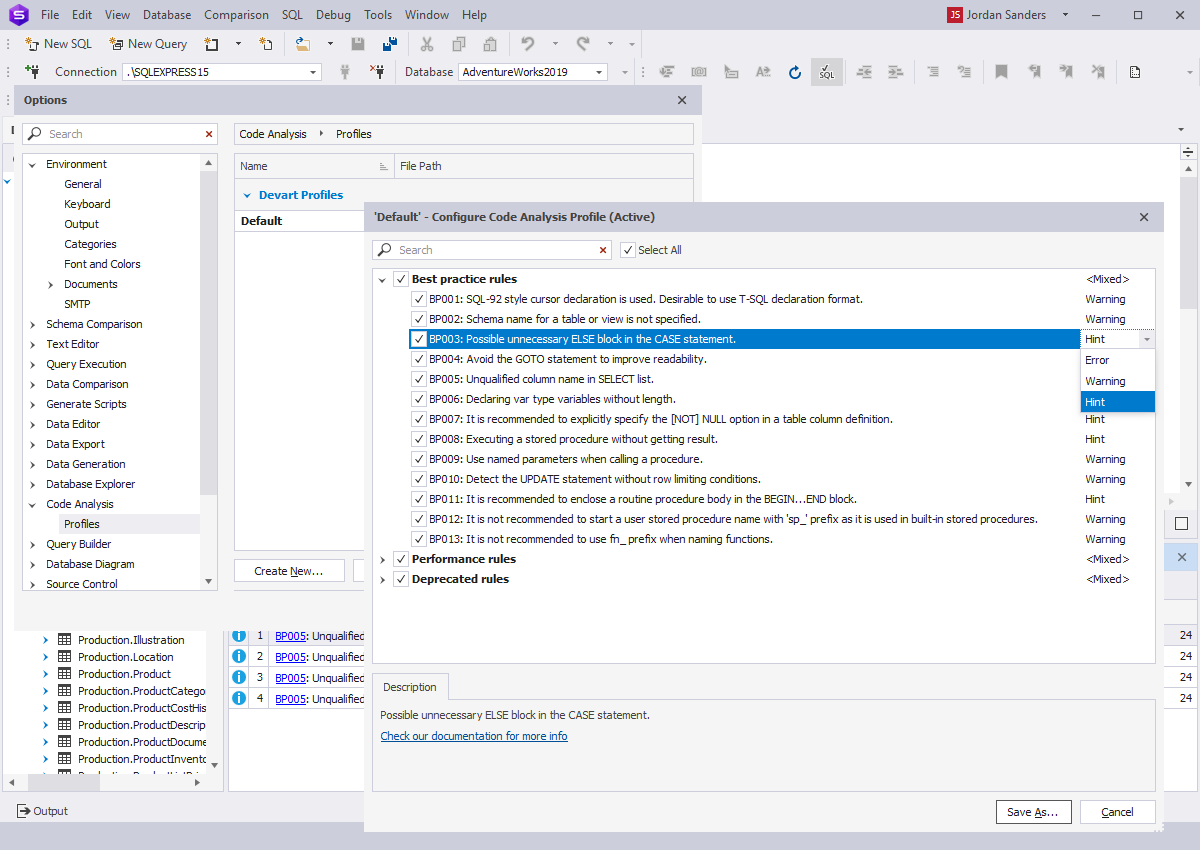
Creating a custom profile is a straightforward process. Navigate to the ribbon and select Tools > Options. In the Options dialog that opens, go to Code Analysis > Profile
and click Create New. In the window that opens, specify the profile name, choose the profile to copy the settings from, and set a file path to store the XML file with the profile settings.
Finally, click OK. This will add a new profile to the list of profiles in the Your Profiles section.
If you want to modify the settings of a specific code analysis profile, select the profile and click Open Selected. In the dialog that opens, all the rules are selected by default and grouped into the following categories:
- Best practice rules that ensure the code follows widely recognized industry standards.
- Performance rules determine SQL constructs that might cause the query to run inefficiently.
- Deprecated rules detect T-SQL keywords or syntax that Microsoft no longer supports.
- Naming rules ensure consistent naming within the database, thus making the code easier to read, navigate, and maintain.
- Execution rules detect issues that might cause problems when the code runs.
To exclude a rule from the profile, clear the checkbox next to the required rule and click Save As. This will remove the rule from the profile, allowing you to customize the code analysis profile settings to your specific needs.
In addition, when you select the rule, you can read its description.
Sharing code analysis rules
You can also share your T-SQL code analysis rules with other dbForge SQL Studio users by sending them an XML file with the settings or saving it in a shared network folder.
You can also export profile settings so other users can open them in dbForge Studio. Navigate to the main Tools menu and select Export and Import Settings
to open the Import and Export Settings Wizard. The Export selected environment settings option is selected by default. Leave it as is and switch to the next page.
On the Choose settings to export page, clear all the checkboxes except for Code Analysis and click Next. On the Save Current Settings page, specify the file name and directory to store the settings,
and click Execute. After that, other users of the Studio can import those settings.
Note that the default location to store the settings
is C:\Users\username\Documents\Devart\dbForge Studio for SQL Server\Settings.


