SQL Reporting and Analysis Tools
SQL for data analysis and reporting is arguably one of the most popular uses for SQL today. This language is widely used, flexible, and has a rather accessible learning curve. All this makes SQL a language of choice when it comes to creating easy-to-use yet functionally complex dashboards and tools for data analytics and reporting.
This is where dbForge Studio becomes an invaluable SQL analytics tool with data visualization,
well-suited for data analysts and business intelligence consultants.
It is the perfect solution for interactions with data. It is an advanced data visualization tool
for SQL with a consistent GUI. It helps you keep your performance high at all times.
How to Create SQL Reports
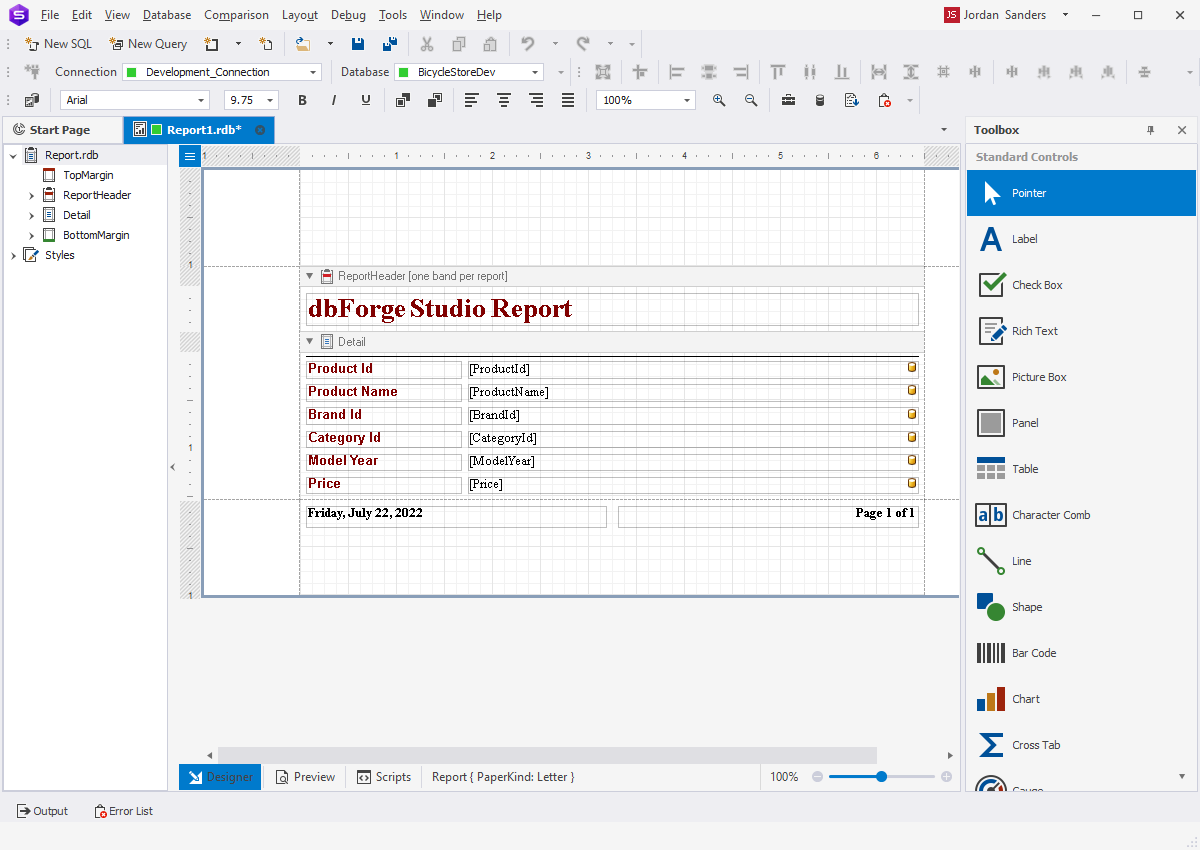
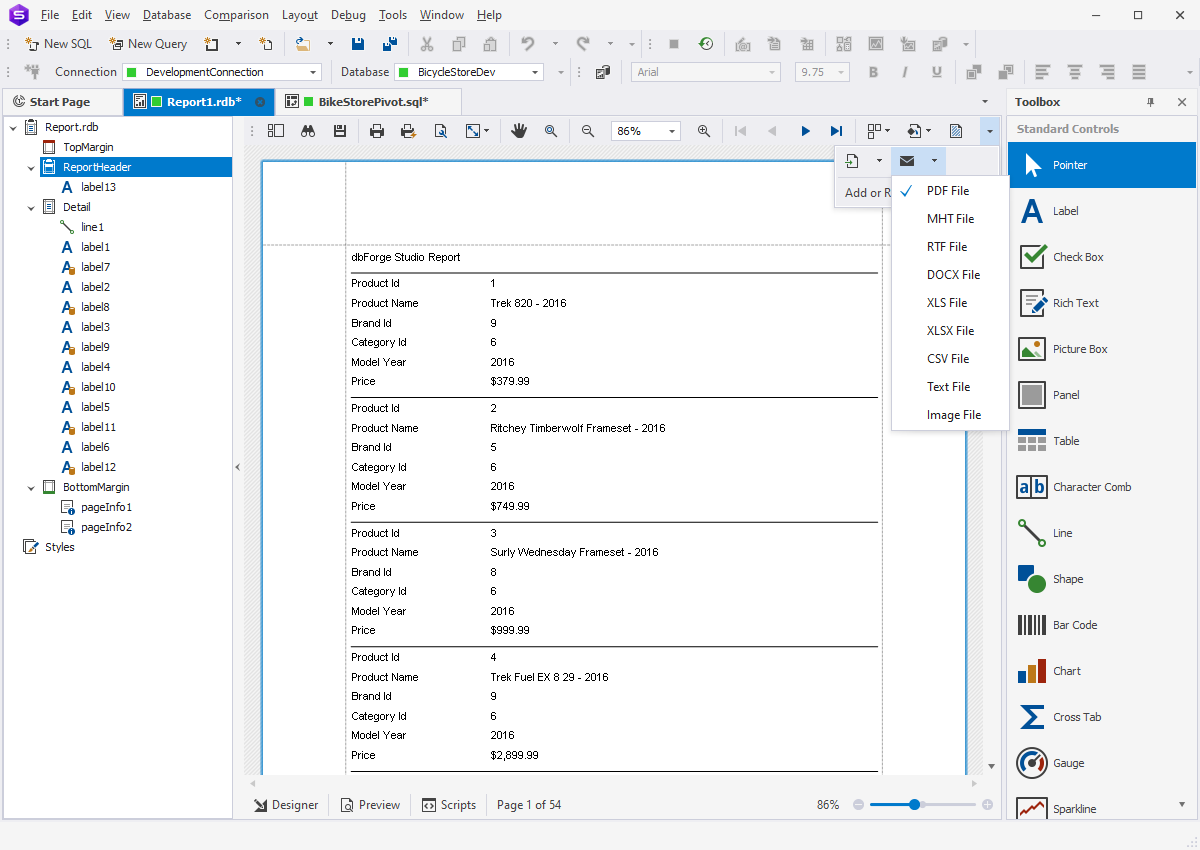
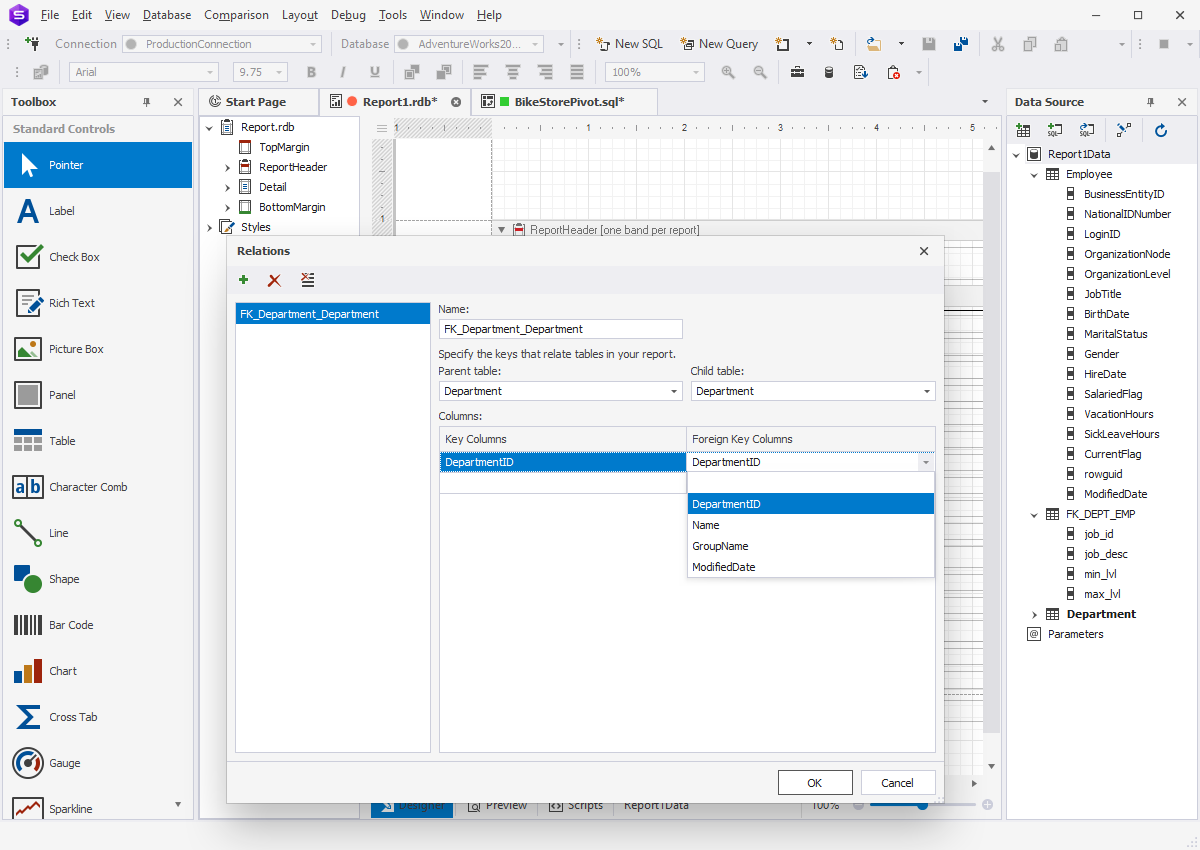
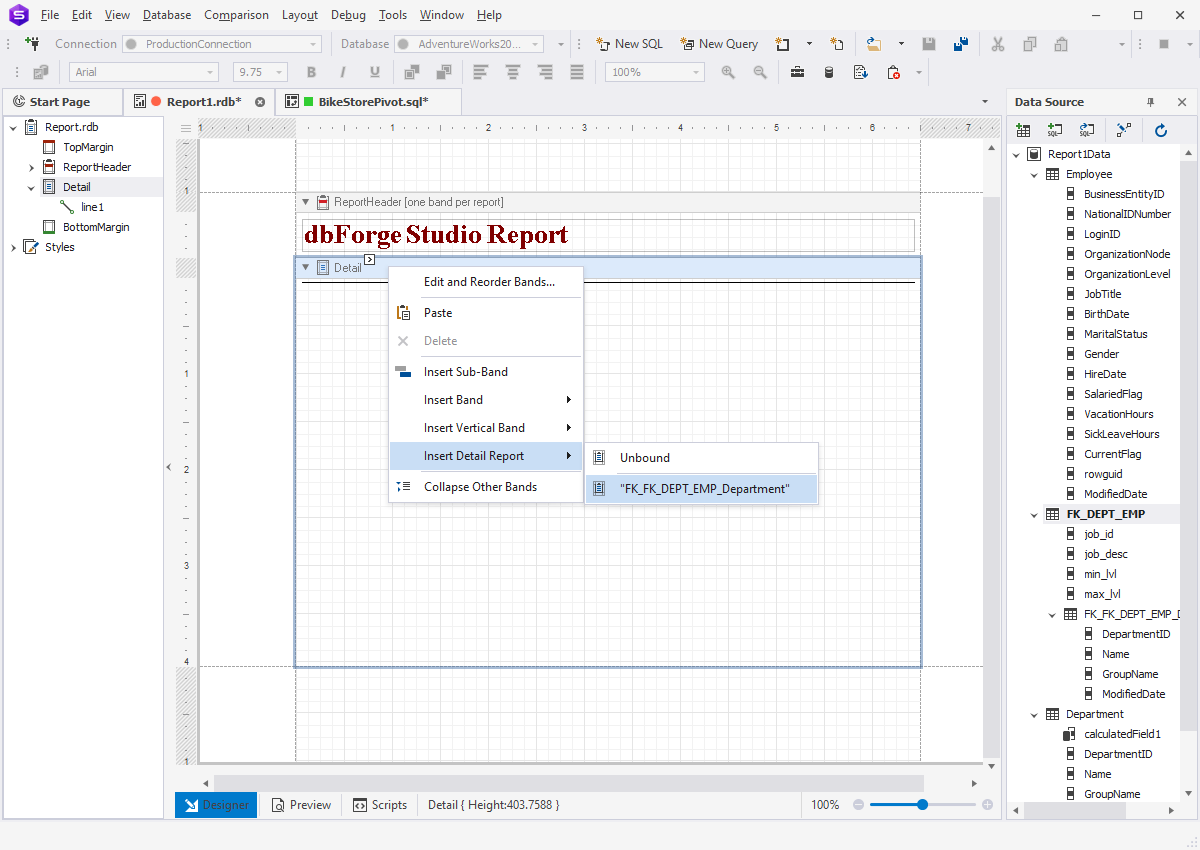
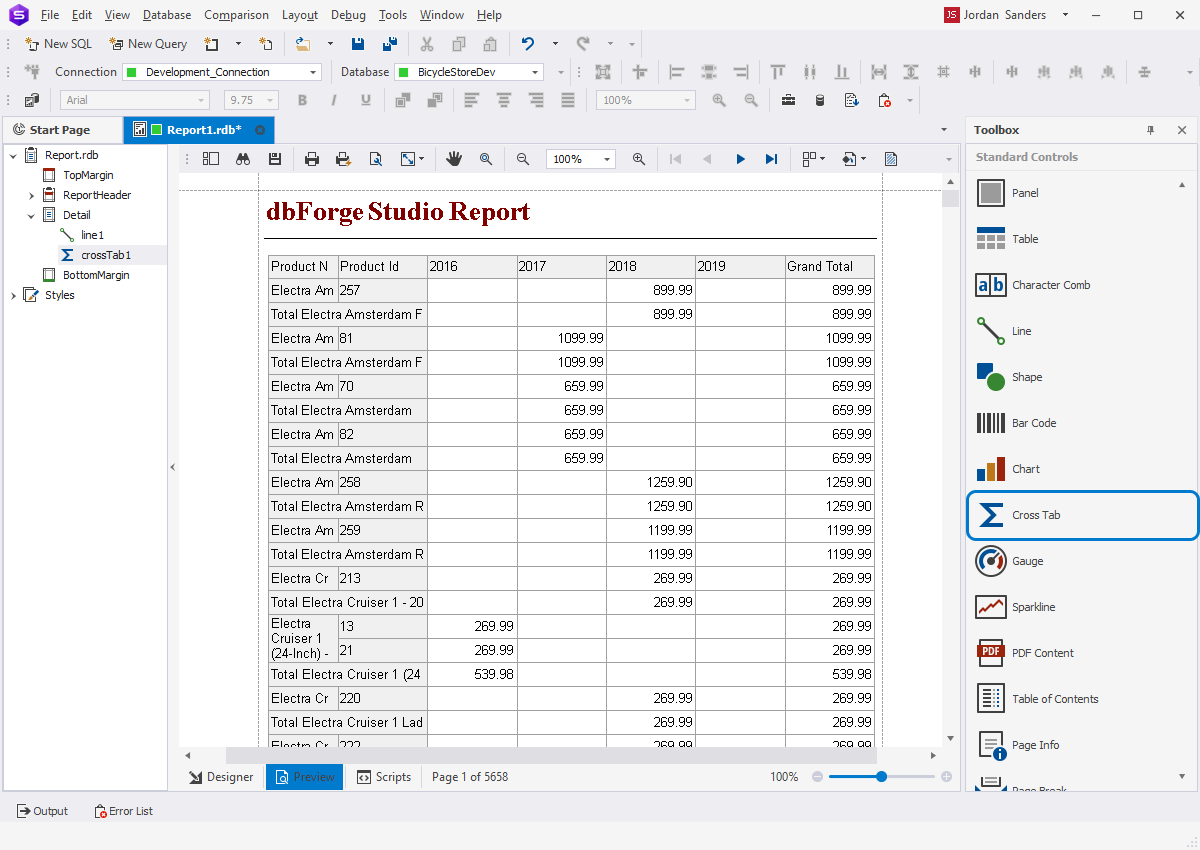
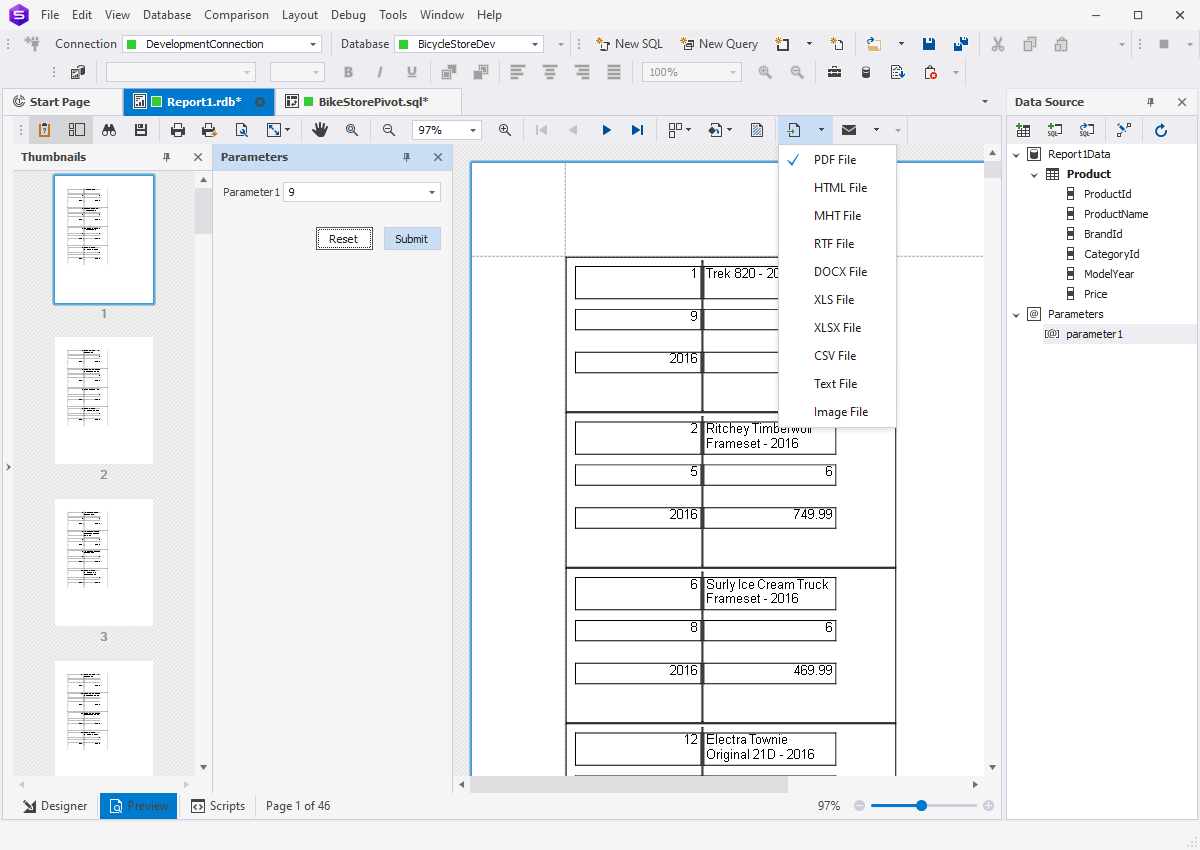
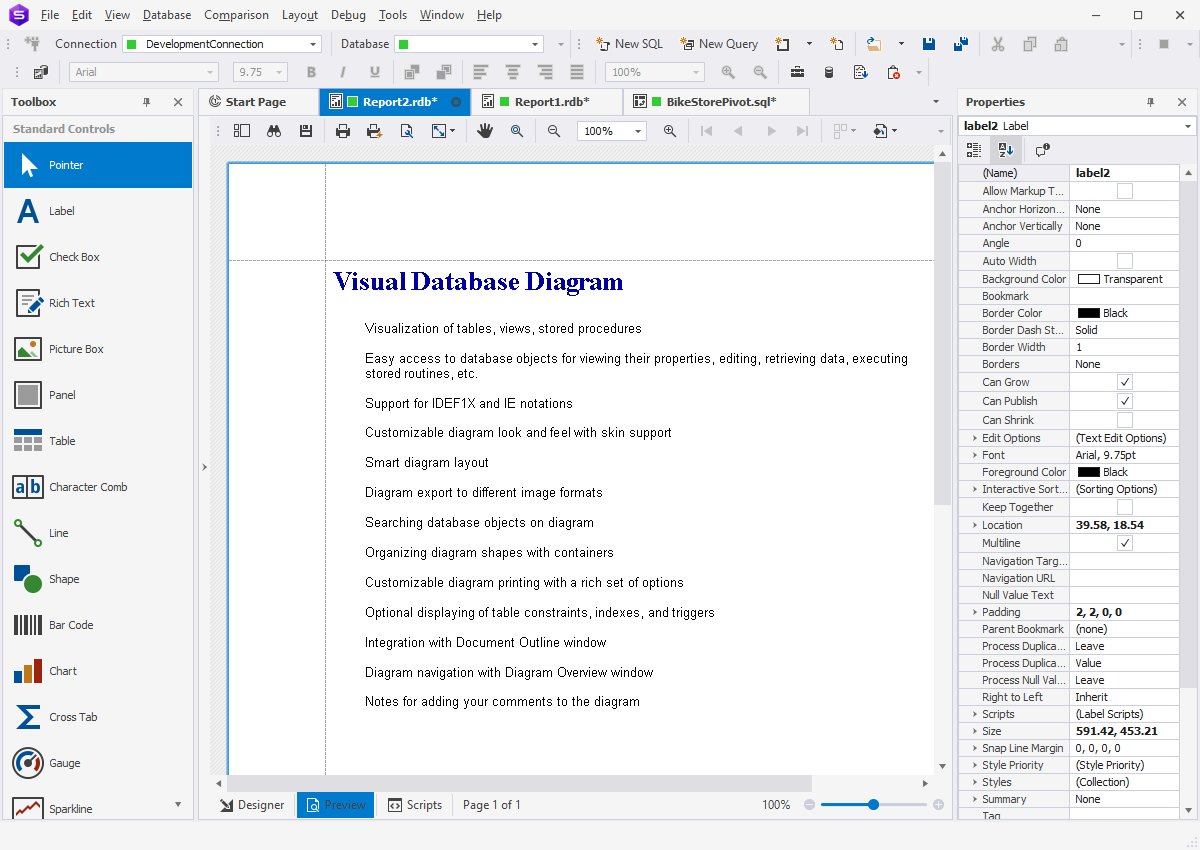
dbForge Studio for SQL Server offers the possibility of creating SQL data reports implemented in the well-known and user-friendly interface. With dbForge Studio for SQL Server, the routine of SQL data analysis and report creating is simplified to several clicks — that means you won't have to spend a lot of time and efforts for SQL report-making any more.
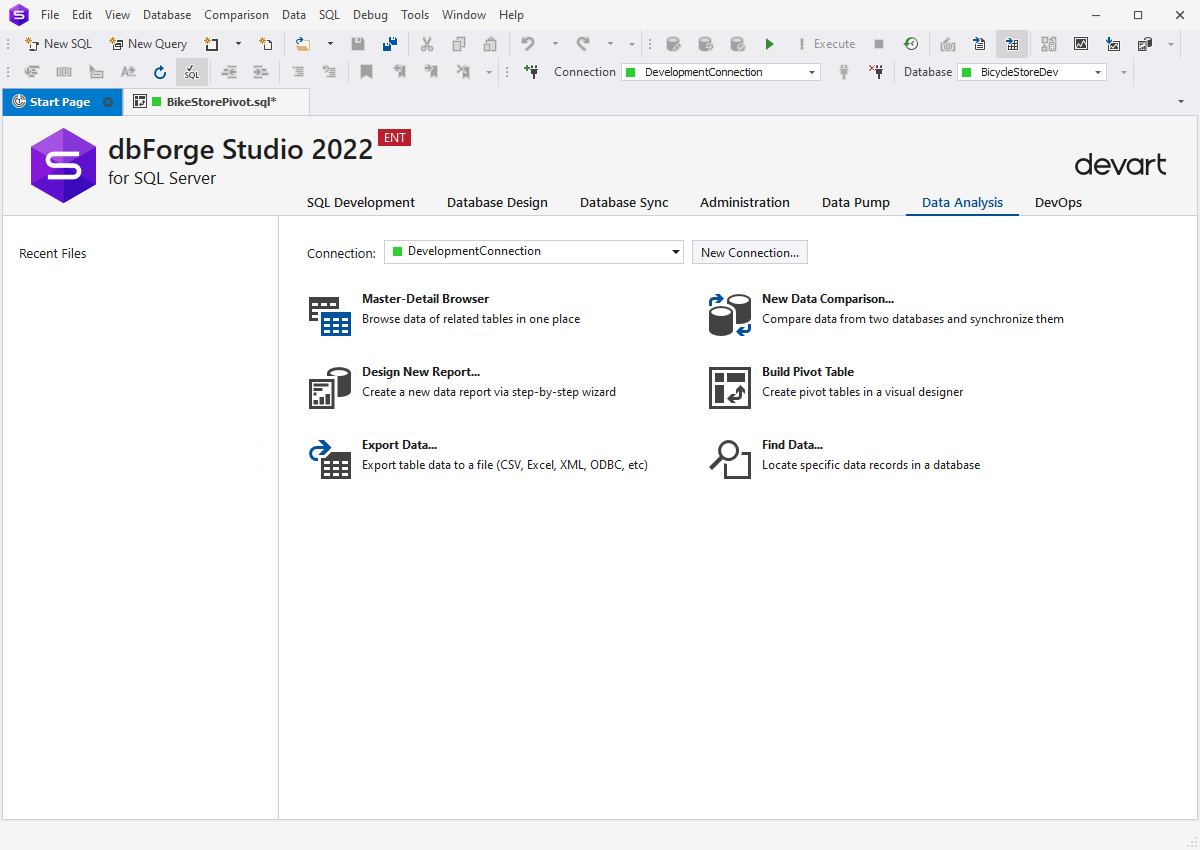
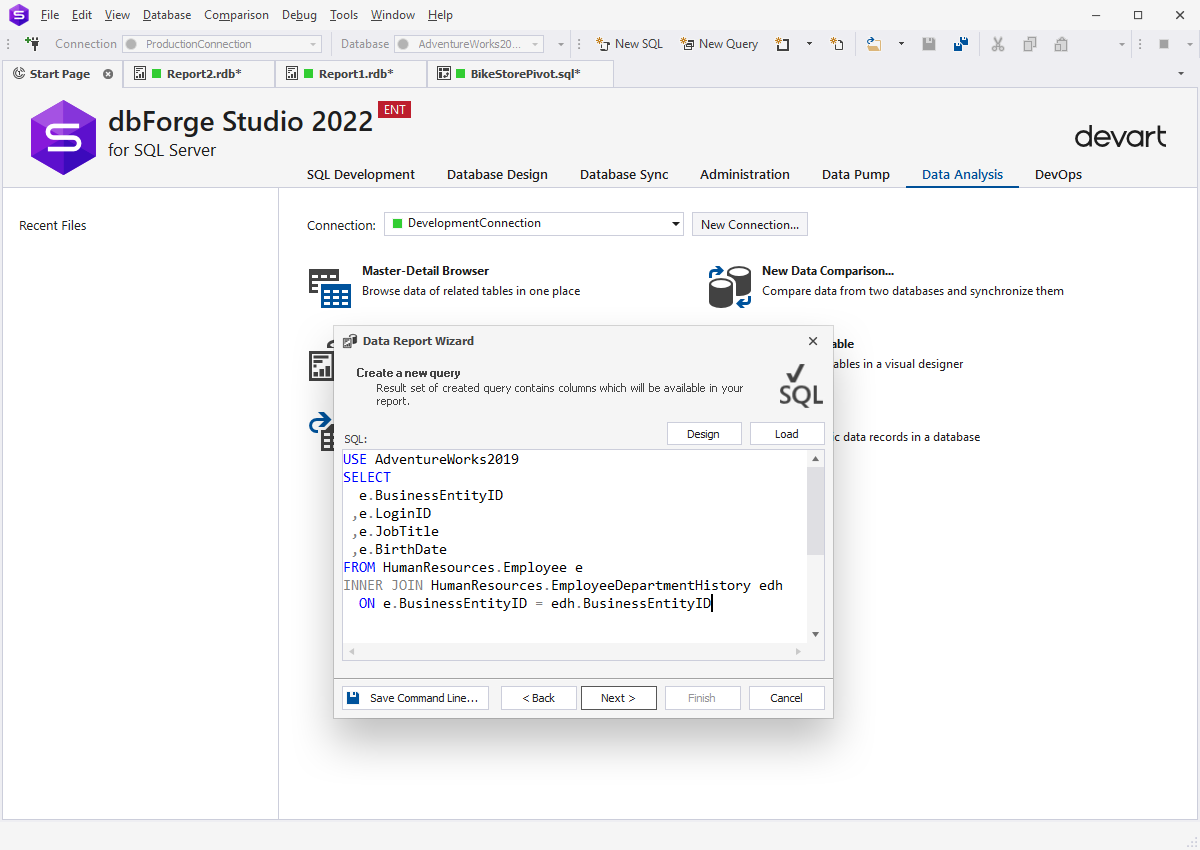
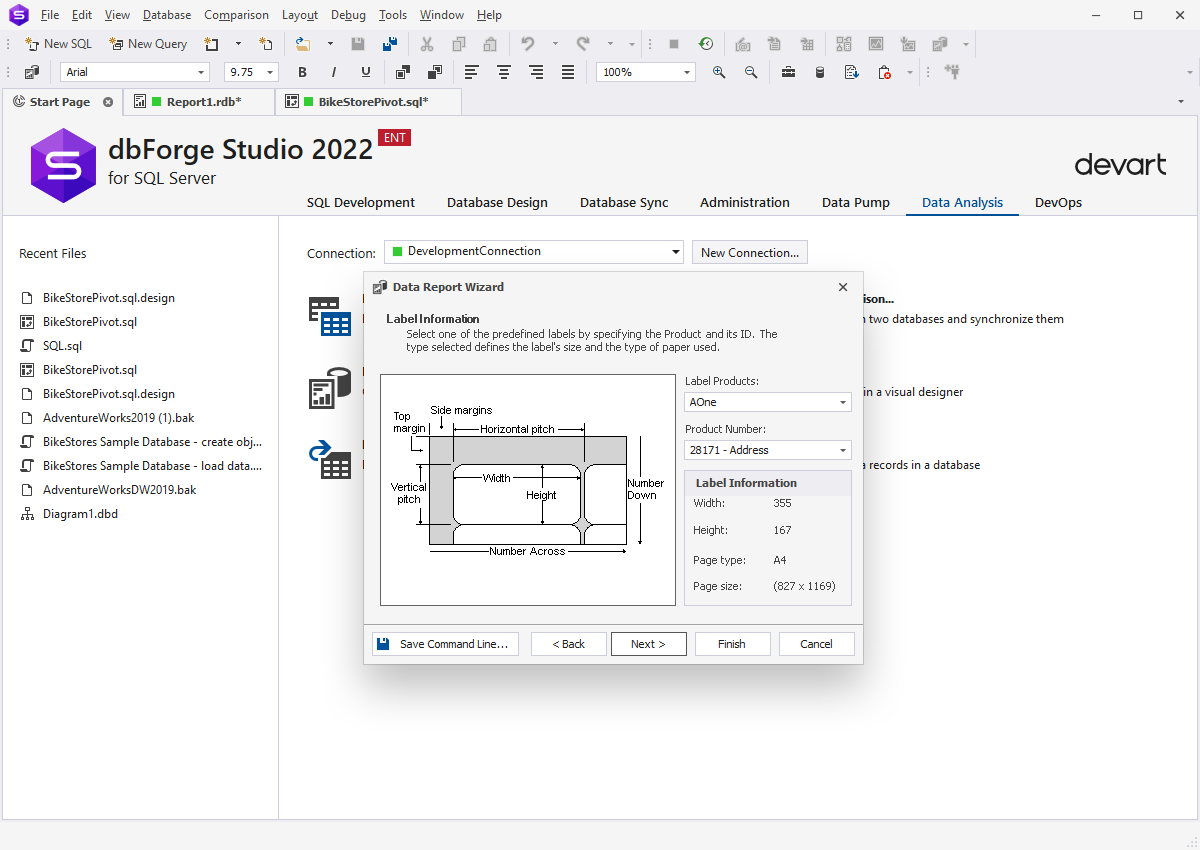
To start generating SQL reports, go to the Start page and select Data Analysis.
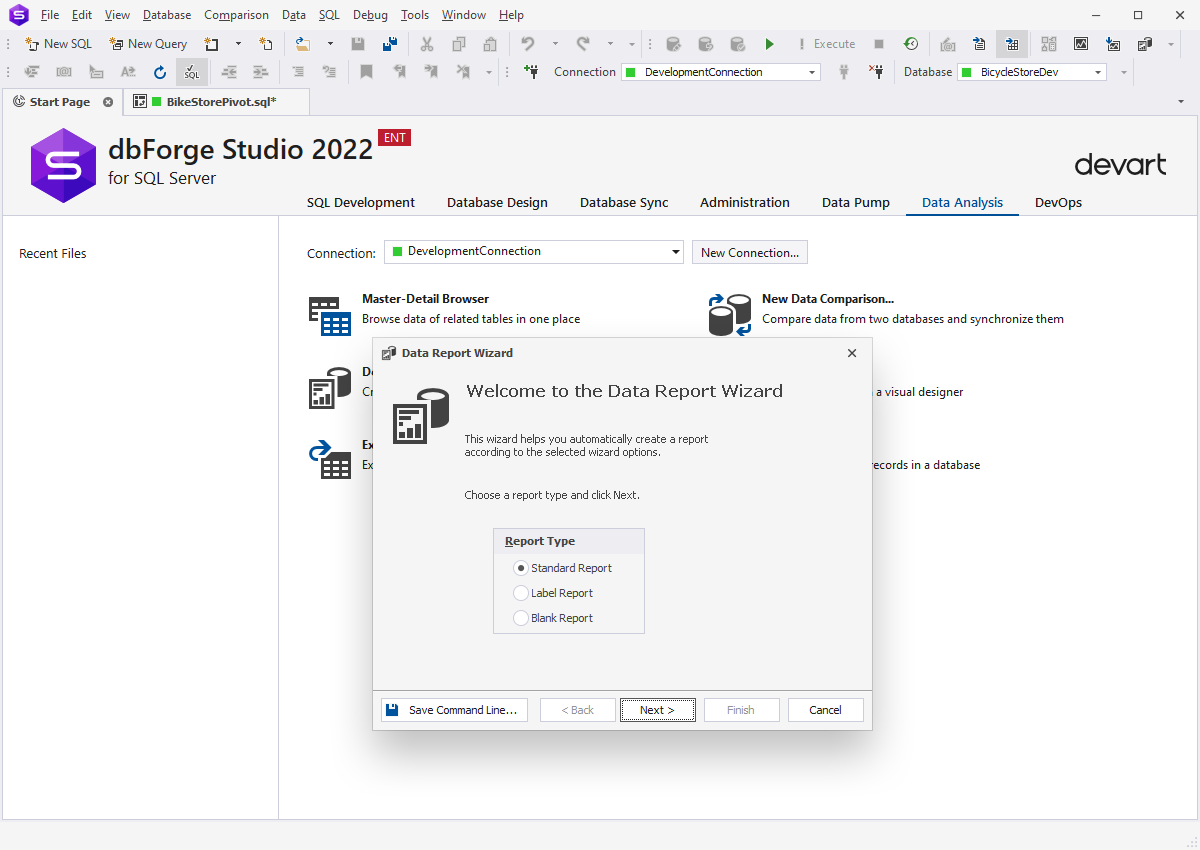
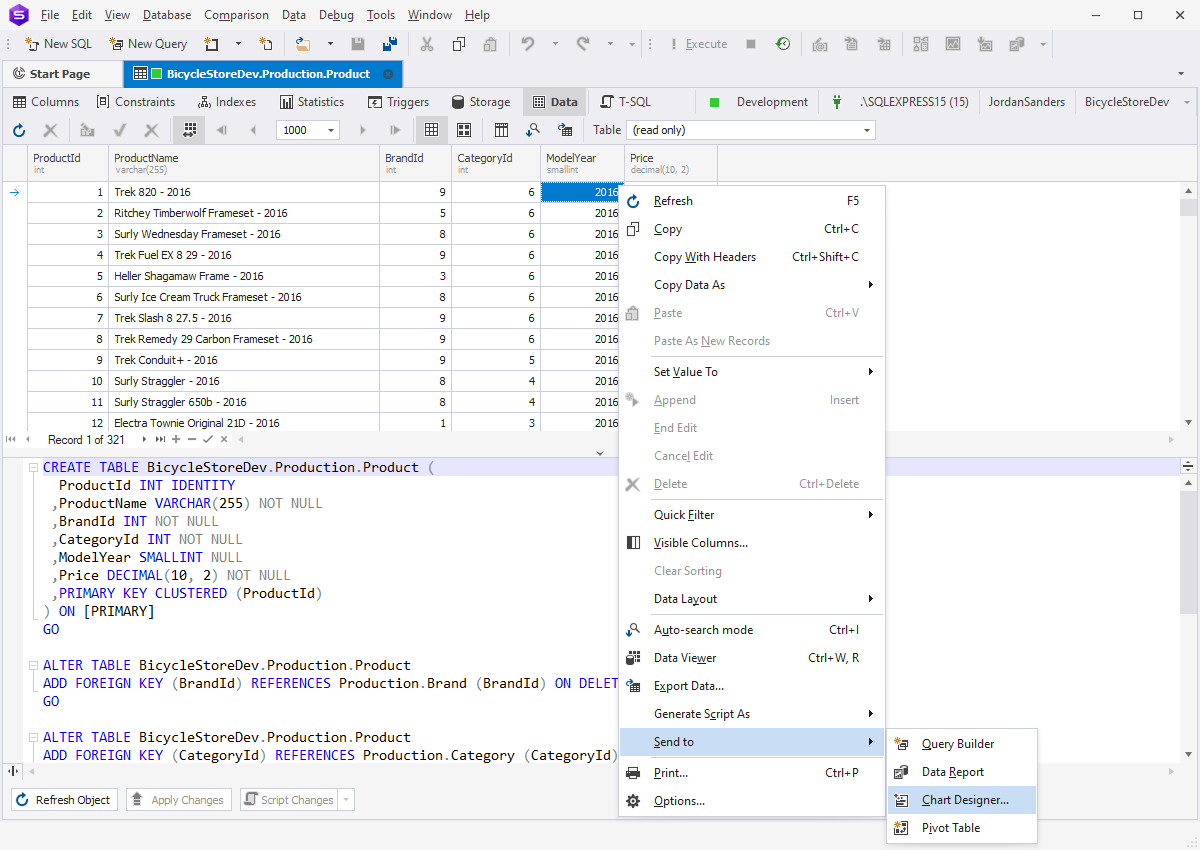
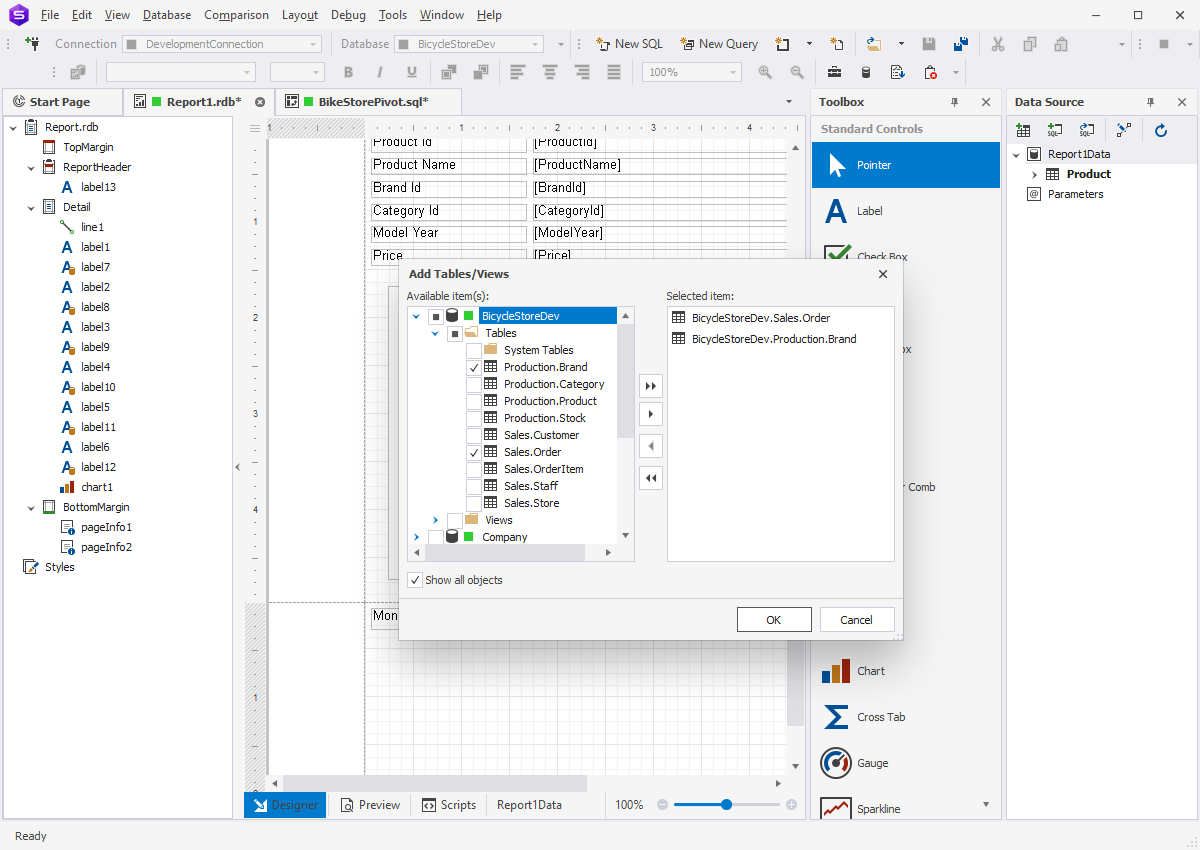
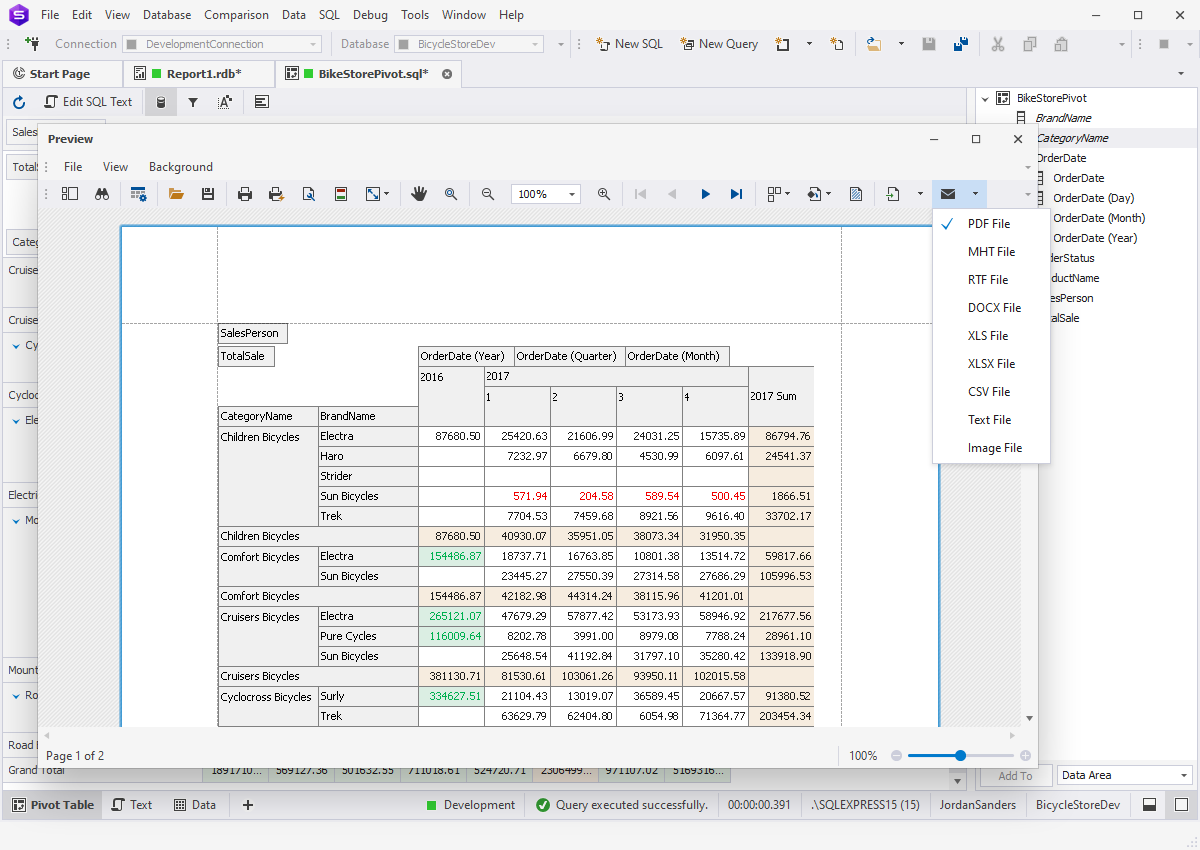
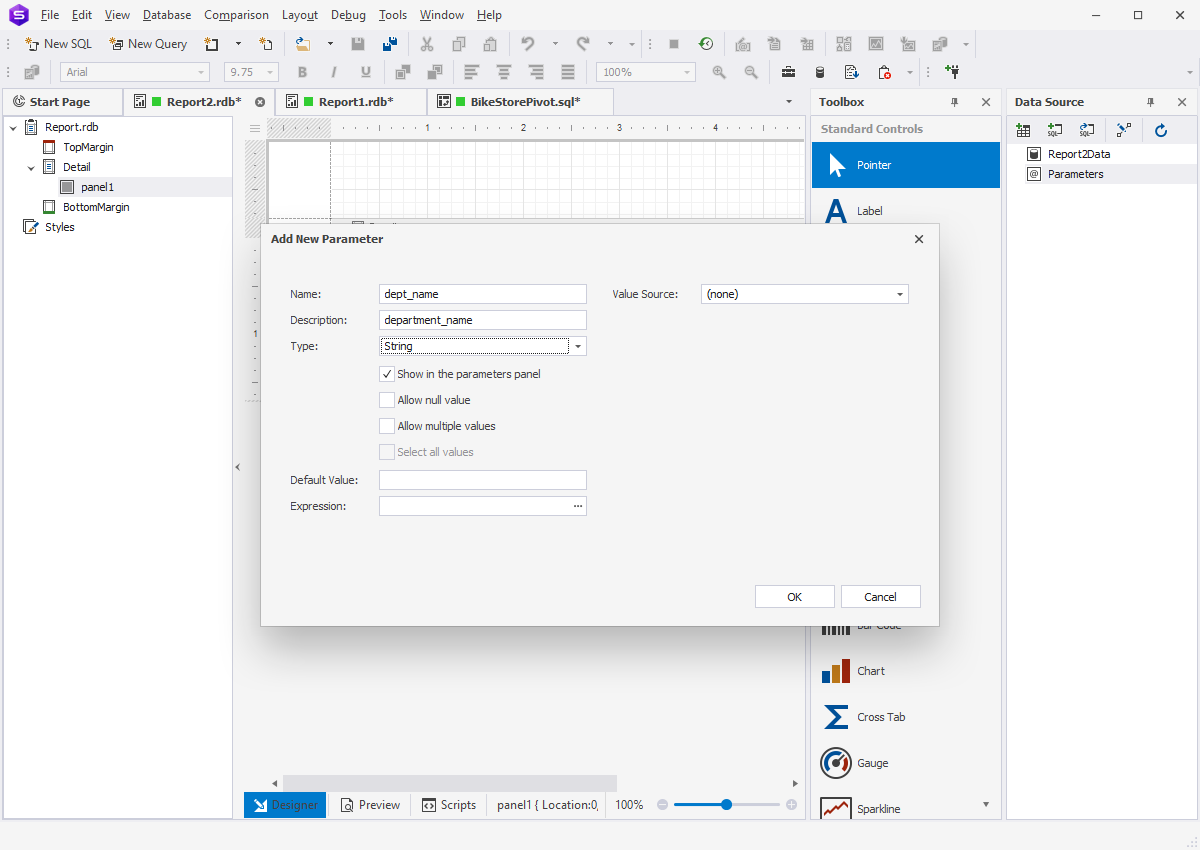
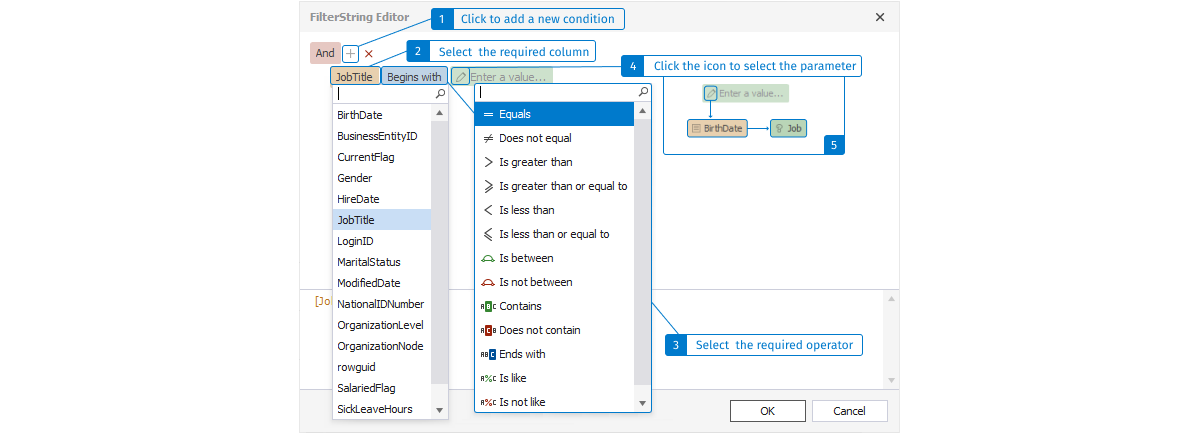
dbForge Studio for SQL Server enables to create various kinds of reports, namely:
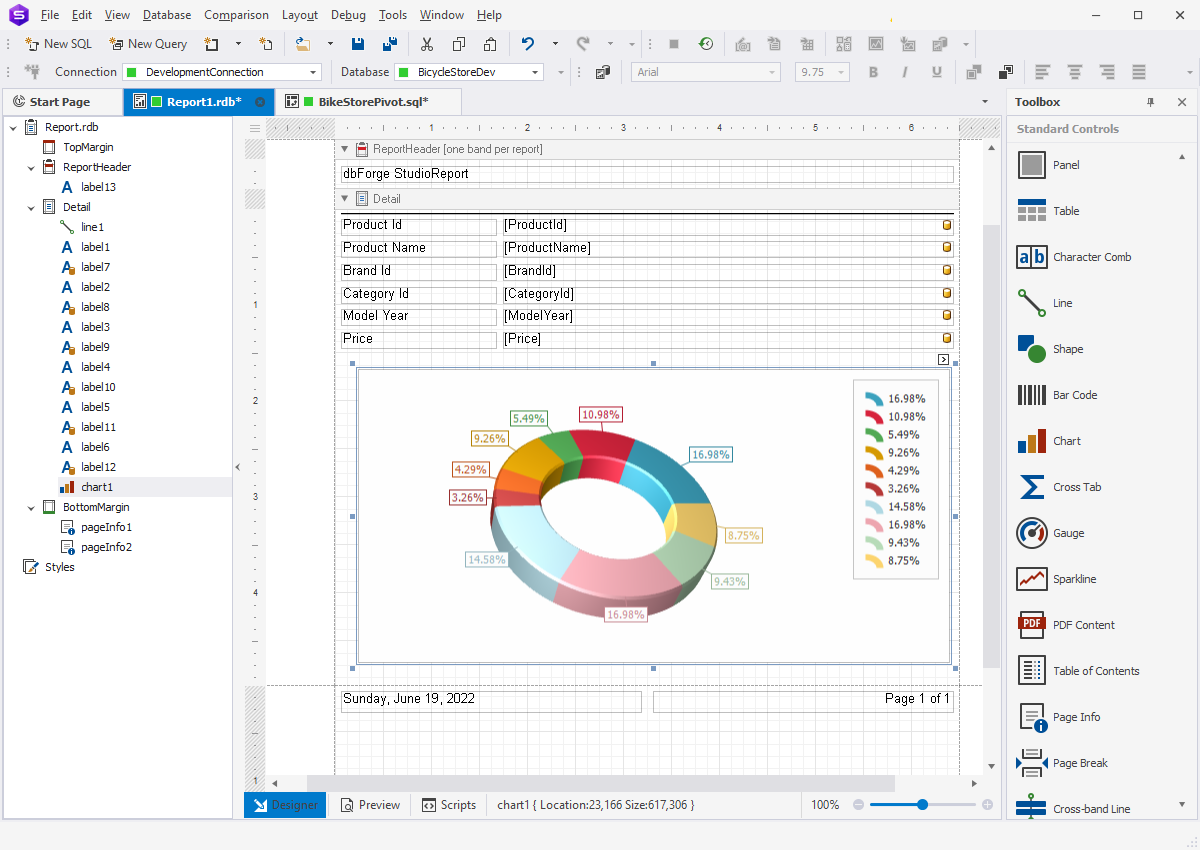
- Data Report
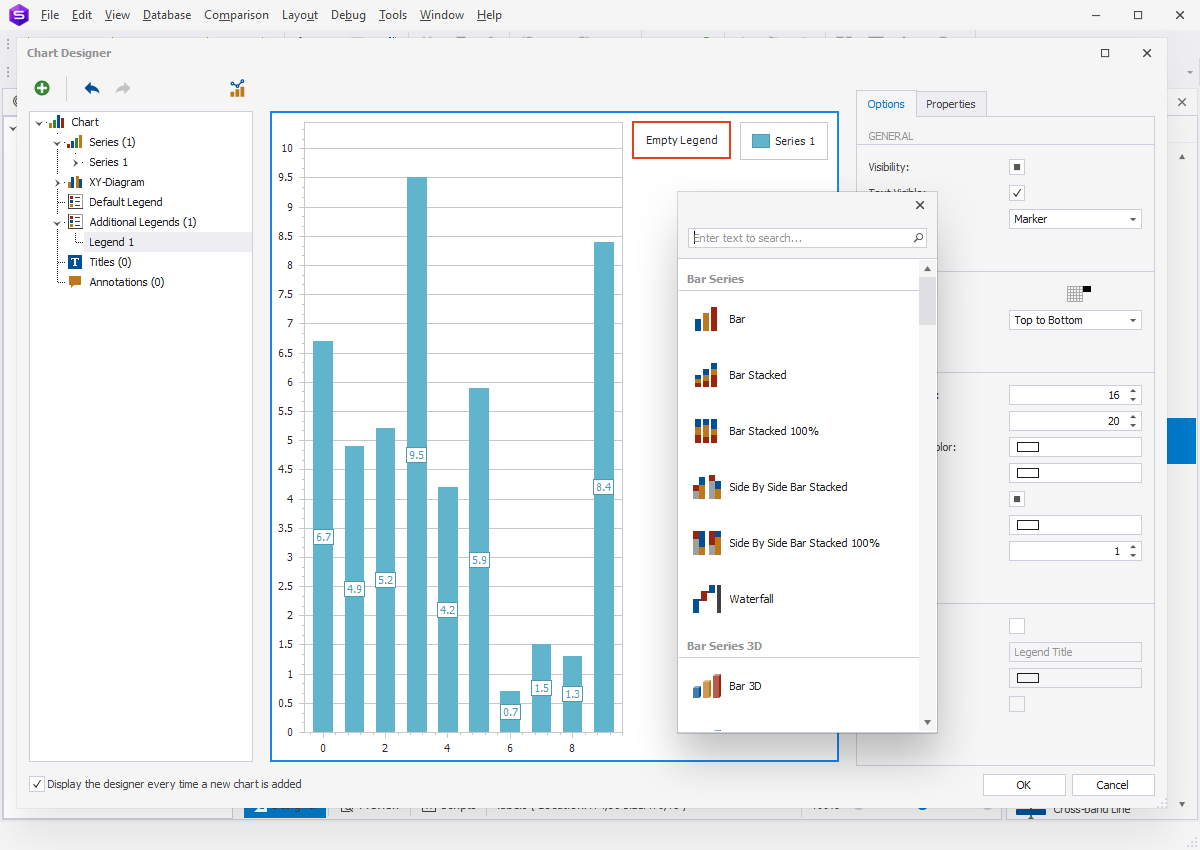
- Chart Report
- Master-Detail Report
- Pivot Table
- Label Report
- Static Report
Let's take a closer look at each type of data reports, available in dbForge Studio for SQL Server.
