It's not always that easy to identify potential issues with your T-SQL scripts.
If one goes unnoticed, it might lead to a query performance bottleneck that will affect your entire database and take lots of time to be eventually fixed.
It might be even harder, though, to find a proper tool that will help you avoid this situation—a smart assistant
that will validate how well your T-SQL code conforms to specified rules, guidelines, and best practices.
And if your database stack revolves around Microsoft SQL Server and SSMS as your primary tool, then one such assistant is right here at your service.
It's called T-SQL Analyzer, and it's available in dbForge SQL Complete,
a high-end SSMS add-in that enhances your SQL coding with autocompletion, formatting, debugging, refactoring—and code analysis.
You should definitely see T-SQL Analyzer in action if you are seeking to improve your coding practices and optimize database performance.
With the help of the Analyzer, things like inefficient queries and missing indexes will no longer stand in your way.
The benefits of T-SQL Code Analyzer
Comprehensive code analysis: The Analyzer conducts an in-depth scrutiny of your T-SQL code, identifying potential performance bottlenecks, syntax errors, and adherence to specified coding standards. The latter can be configured in the Analyzer's settings via a rich selection of categorized rules.
Database performance optimization: The results of each analysis conveniently show areas for improvement, and you can optimize your code for better performance.
Growth of personal productivity: It goes without saying that running a script through the Analyzer takes next to no time yet yields invaluable results. You instantly know what should be tweaked, and you will not waste any time making corrections in your scripts post factum. Thus you will become more focused and productive.
Code analysis
Your actual work with T-SQL Code Analyzer will be extremely easy.
Open a query document in SSMS and type or insert a piece of T-SQL code that you would like to analyze.
Then right-click anywhere in the document and select Analyze Code from the shortcut menu.
Wait a few moments while the Analyzer checks the code and returns an Error List with the identified issues.
Now you can examine them and tweak your code accordingly. Additionally, the information regarding the results of the analysis will be displayed in the Output window.
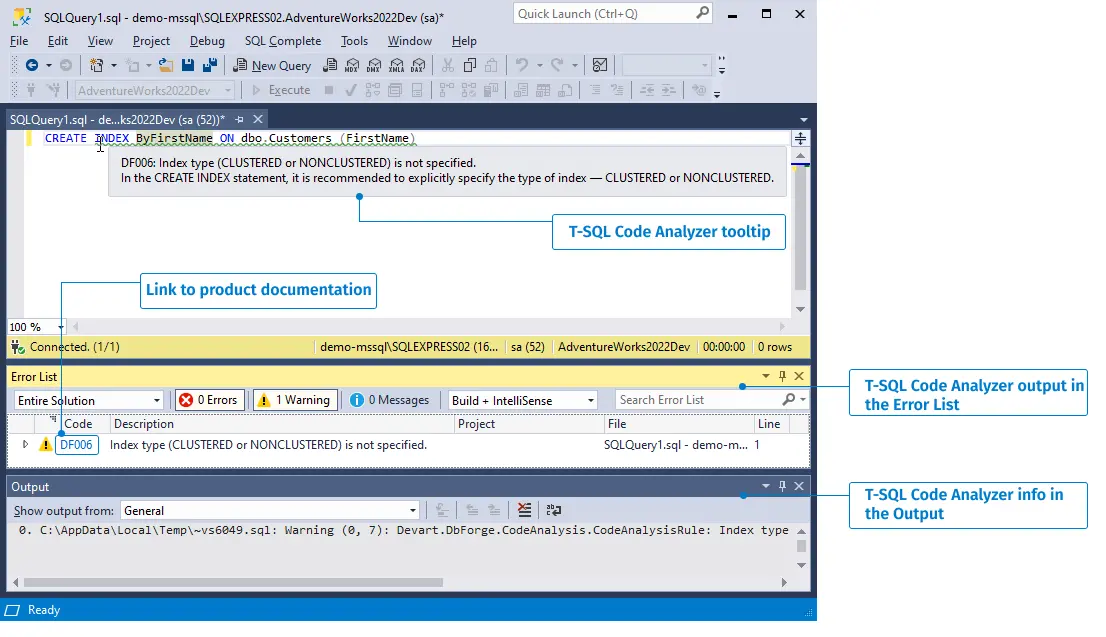
Every issue has been assigned a dedicated code, which is displayed in the Error List window.
If you click it, you will be taken to the corresponding page in our product documentation, where you'll be able to learn more about it.
Finally, you can re-run your corrected code in the Analyzer—and once the Error List is empty, everything is perfect.
Error List
There are three types of issues: errors, warnings, and hints. All issues are displayed in the Error List as a table.
The Code column displays the rule identifier, clicking which will open a detailed description of the rule in the product documentation.
The Description column contains the rule title. The File column shows the document name where the analysis is being conducted,
and the Line column shows the number of the line where the rule has been triggered.
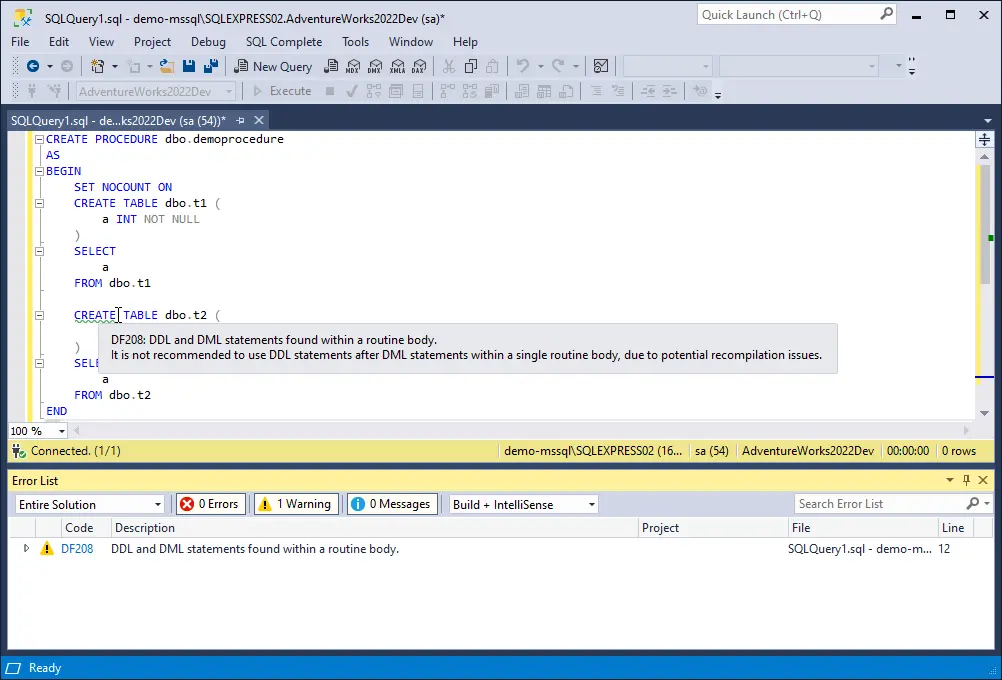
Also note that when a rule is triggered in a SQL document, the corresponding code is underlined with a wavy line.
Hovering over this code displays a hint with additional information that you can inspect.
By the way, if you analyze a large chunk of code, you don't need to search for the location of the identified issue manually.
Simply right-click the issue you want to fix and select Go to Error from the shortcut menu.
You will be immediately taken to the required part of the code.
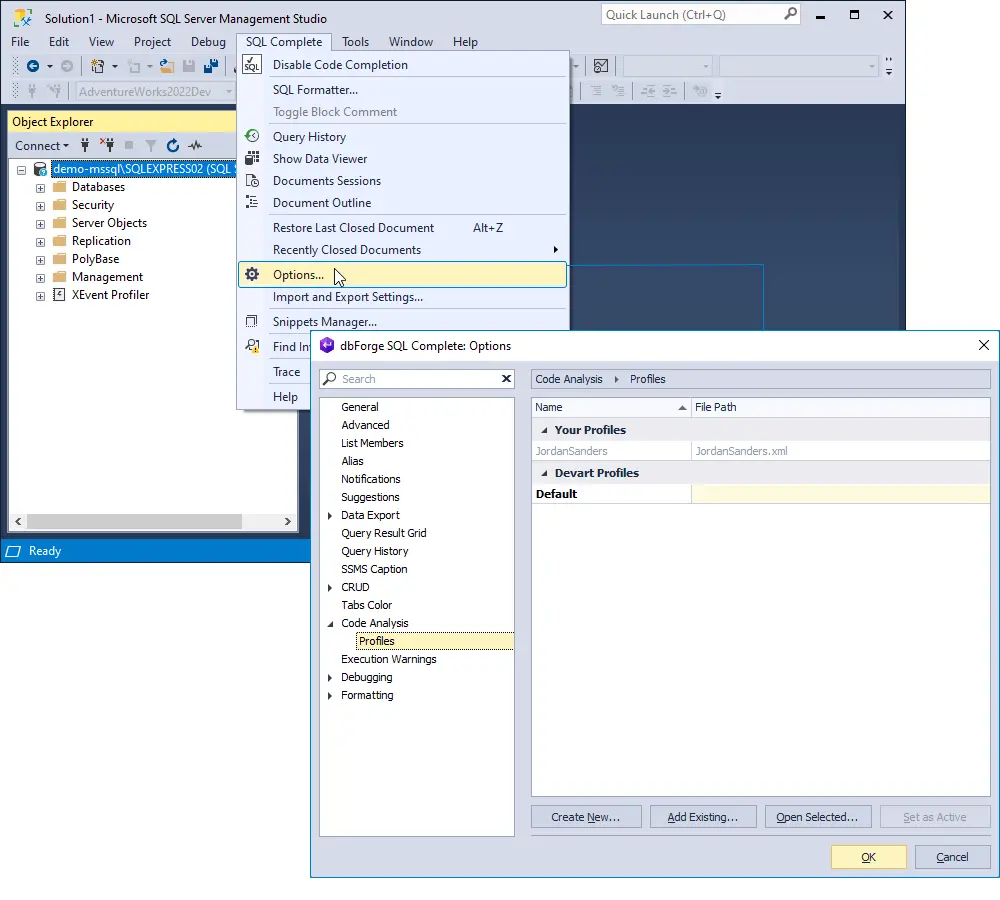
Code analysis profiles
Before starting your work with the Analyzer, you most certainly want to configure the rules (or entire sets of rules) that the analysis will be based on.
To do that, go to the SQL Complete menu, select Options, and proceed to Code Analysis > Profiles. Here you can create and modify analysis profiles, add and remove them from your library,
and set the preferred profile as the active one. You have one predefined Default profile to start with; however, you can use it as the basis for your custom profiles.
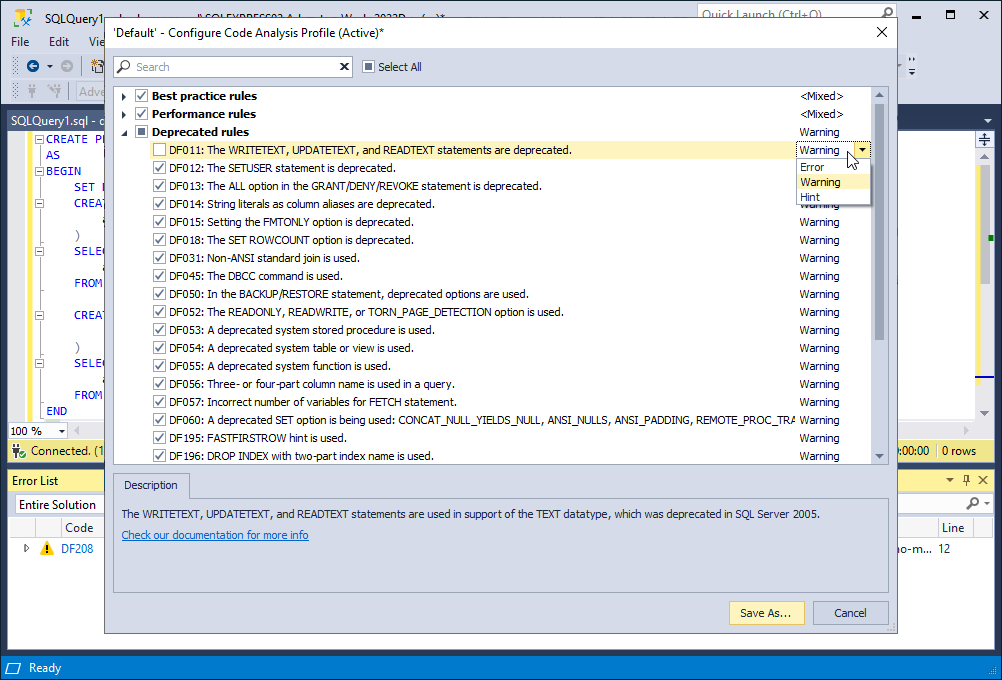
Every profile comprises a selection of rules divided into several groups, each focused on a specific goal,
whether it's keeping your code easily readable, ensuring the high performance of your queries, or helping you avoid deprecated constructs in your code or possible troubles with execution.
For instance, in the Default profile, all the checkboxes are selected, which means all rules are activated. To deactivate any of them, simply clear the corresponding checkboxes and save your changes.
Video tutorial
To help you get started most effectively, we have prepared a bonus for you—a detailed tutorial that will help you get acquainted with the Analyzer in just three minutes.