MySQL Profiler Tool for Query Analysis
Query Profiler built into dbForge Studio for MySQL provides 360-degree visibility into query execution, helping you analyze and maximize the performance of
MySQL and MariaDB databases. With Query Profiler, you get a clear step-by-step breakdown of how your MySQL queries are executed, immediately followed
by an action plan designed to eliminate issues and accelerate query performance.
Whether you write and execute SQL queries to update your database, design schemas, model data requirements, or configure data pipelines,
Devart's MySQL profiler tool facilitates your workflows by taking the guesswork out of query optimization during database development and maintenance.
By walking you through every stage of query execution, it provides a clear picture of how it runs and whether it impacts your application.
Devart's MySQL Query Profiler enables you to take a proactive approach to improving your database performance:
- View the EXPLAIN plan and profiling results and monitor session statistics
- Save time on detecting bottlenecks in your queries
- View time delays at different stages of executing a query
- Compare differences in query profiling results visually
- Get a clear and automated way to profile your database queries
- Fetch MySQL query data faster
- Trace MySQL queries and diagnose performance issues with slow queries
Watch the video to see MySQL Query Profiler in action. Learn how it makes database development a whole
lot easier and more efficient. It is a great optimization tool for query profiling in MySQL and investigating
performance issues.

Why query profiling matters in modern MySQL/MariaDB development?
When working with databases, MySQL profiling and query optimization are no longer optional—they have secured their place in the league of must-haves. In systems running on MySQL and MariaDB, it is often difficult
to pinpoint the cause of performance deterioration when it is not a result of an obvious error. This is what profiling is for—it reveals what actually slows down query performance.
Slow-running queries not only affect application performance, they can significantly raise infrastructure costs. Suboptimal querying may cause higher CPU usage and memory consumption. This is one of the reasons why query
optimization is essential in building modern software products.
Query profiling helps you take the guesswork out of database performance and turn it into something you can measure, predict, and improve to save costs and increase delivery speed. An effective MySQL
profiler supports database developers and administrators in more than one way.
Profiling for performance tuning
Query profiling is an important step in database performance optimization. Whether you seek to improve user experience by accelerating the application, lower infrastructure costs,
increase scalability—or all of the above—start with profiling your queries. It will provide lots of useful information and help you put together an actionable optimization plan:
- Detection of slow queries and inefficient execution plans
- Identification of missing indexes, full table scans, and other performance bottlenecks
- Suggestion of targeted improvements
Profiler as a debugging tool
If you notice that your database is performing incorrectly or slowly, query profiling can show you exactly why. By pinpointing issues, the tool helps you resolve them faster, reduce
application downtime, and achieve higher system predictability. Analyzing profiling results, you can identify causes of suboptimal performance:
- Long-running queries and lock contention
- Deadlocks and timeouts
- Performance drop under increased loads
Profiling to support CI/CD and DevOps
With query profiling, database DevOps can introduce performance optimization into automated delivery pipelines. Query profiling applied to development or staging environments can
intercept slow code before it reaches production and minimize computing resource consumption by identifying root causes of performance inefficiencies:
- Regressions after code changes
- Performance drops below the established baselines
- Unnecessary data scans
Profiling for cost optimization
The ability to profile MySQL query performance can help save the resources allocated to database management.
As database efficiency is directly related to infrastructure costs, it is important to identify causes for slow performance that lead to higher CPU or memory consumption:
- Wasteful queries
- Suboptimal load distribution
- Unnecessary reads and writes
Who should use MySQL Query Profiler?
Depending on the role, Query Profiler delivers value in different ways; however, its core principle is the same—it replaces guesswork and assumptions with measurable insights.
It helps capture, analyze, and understand MySQL query activity, simplifying the processes of performance tuning and troubleshooting.
Developers and engineers
For database developers and engineers, Query Profiler is primarily a debugging and optimization tool.
Typical use cases:
- Identifying slow queries in new or updated features
- Understanding performance differences in staging and production environments
- Analyzing execution patterns during load testing
- Detecting missing indexes and other table inefficiencies
Database administrators (DBAs)
Database administrators mostly use Query Profiler for monitoring and diagnostics.
Typical use cases:
- Tracking query activity in real time
- Detecting slow or resource-intensive queries
- Performance tuning
- Investigating performance issues
Architects and C-level leaders
For architects and leadership roles, the value of Query Profiler lies in strategic visibility.
Typical use cases:
- Evaluating database scalability
- Planning the infrastructure
- Assessing the performance impact of new or updated features
- Supporting investment decisions or hardware upgrades
Analysts and BI professionals
Analysts and BI teams use Query Profiler to ensure the efficiency of queries they use in analysis and reporting.
Typical use cases:
- Optimizing complex queries
- Improving dashboard response times
- Identifying performance bottlenecks in BI tools
- Reducing load on production systems
DevOps engineers
For DevOps teams, Query Profiler becomes an assistant in ensuring continuous performance and monitoring automation workflows.
Typical use cases:
- Monitoring query performance during deployments
- Validating performance in CI/CD pipelines
- Detecting regressions after updates
- Supporting load testing
Core features of MySQL Query Profiler
Let's look at the practical benefits of Query Profiler.
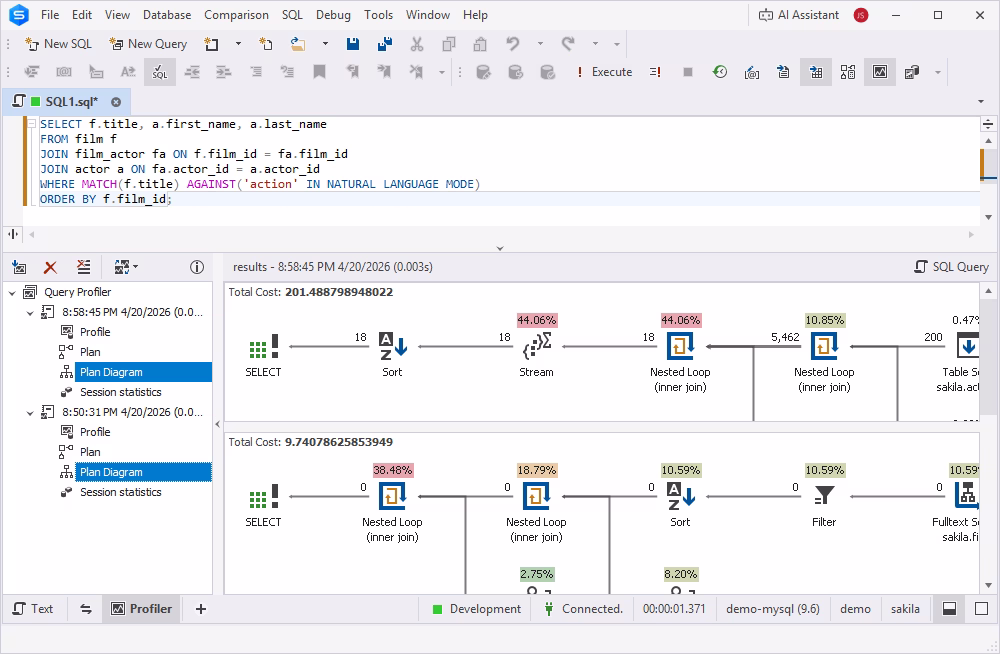
Pinpoint issues with the visual EXPLAIN tree
The EXPLAIN tree transforms the traditional table-based EXPLAIN output into an intuitive, hierarchical diagram that shows how the database processes the query. It is designed to accelerate and
simplify query optimization, especially for complex statements or large datasets.
It resolves multiple pain points that developers and DBAs struggle with when debugging MySQL queries:
- Execution order is not always obvious.
- JOINs need to be analyzed across multiple columns.
- Nested subqueries can be hard to take into account.
- Optimization opportunities (such as missing indexes or scan scopes) are not immediately visible.
The EXPLAIN tree, with its clear, graphical hierarchy, makes interpretation of query processing much easier:
- Each node represents a separate query operation.
- Parent-child relationships are visible and show the execution flow.
- Nested operations are visually grouped.
- Index usage and optimization suggestions are displayed in the diagram context.
- Table access order, JOIN execution, filtering, and table scans are visually traceable.
For developers and DBAs, the EXPLAIN tree means shorter debugging cycles, transparent performance diagnostics, and faster decision-making.
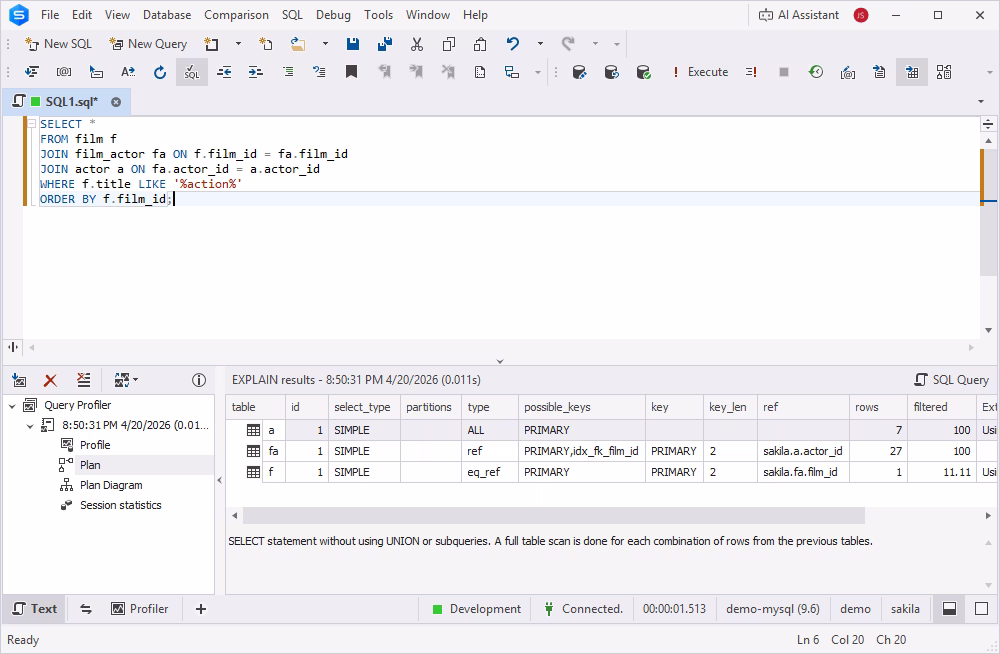
Optimize queries with the EXPLAIN plan
To achieve better query performance with the least resource consumption, use the MySQL EXPLAIN plan
in Query Profiler.
The EXPLAIN plan allows you to get a full picture of how operations are executed and in which the most appropriate order the tables are joined and accessed to run the statements in MySQL databases. Also,
it displays how long it takes to process the number of rows.
Analyzing the execution plan output helps you estimate the query performance and consider whether adding indexes to find rows will make a difference in query execution efficiency.
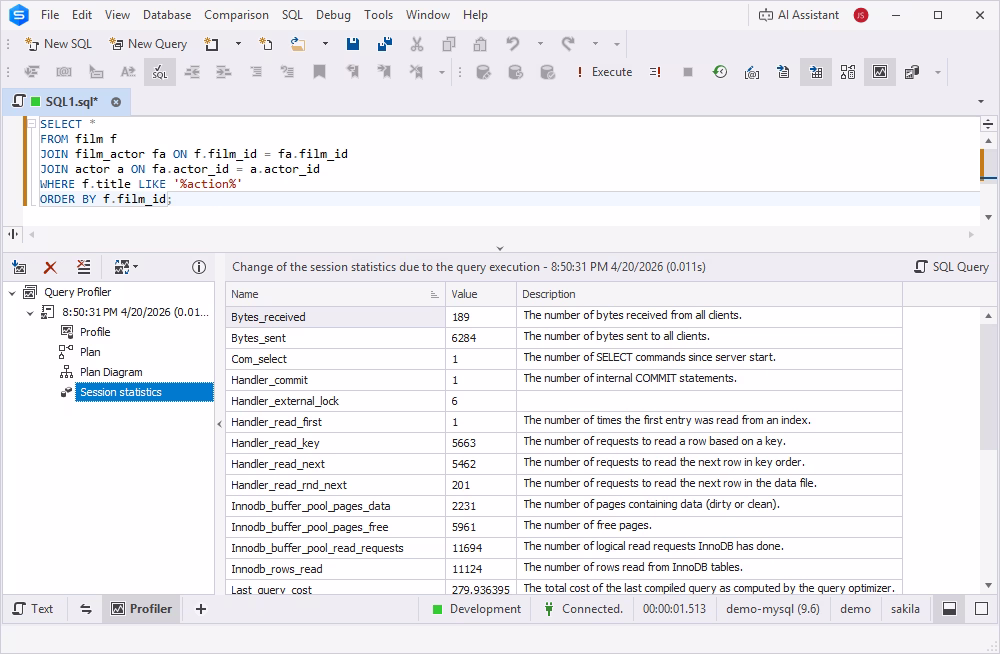
Get STATUS variables calculated for your query
Query Profiler automatically compares STATUS variables for the query before and after execution. You can find the differences in the Session statistics tab of the
Query Profiler tree. Session statistics data is displayed as a grid and refers to the current connection. This information allows you to monitor MySQL query performance
and to decide where to search for bottlenecks and start optimizing MySQL queries.
With Session statistics, you can easily view the amount of resources used to execute the query for the current session.
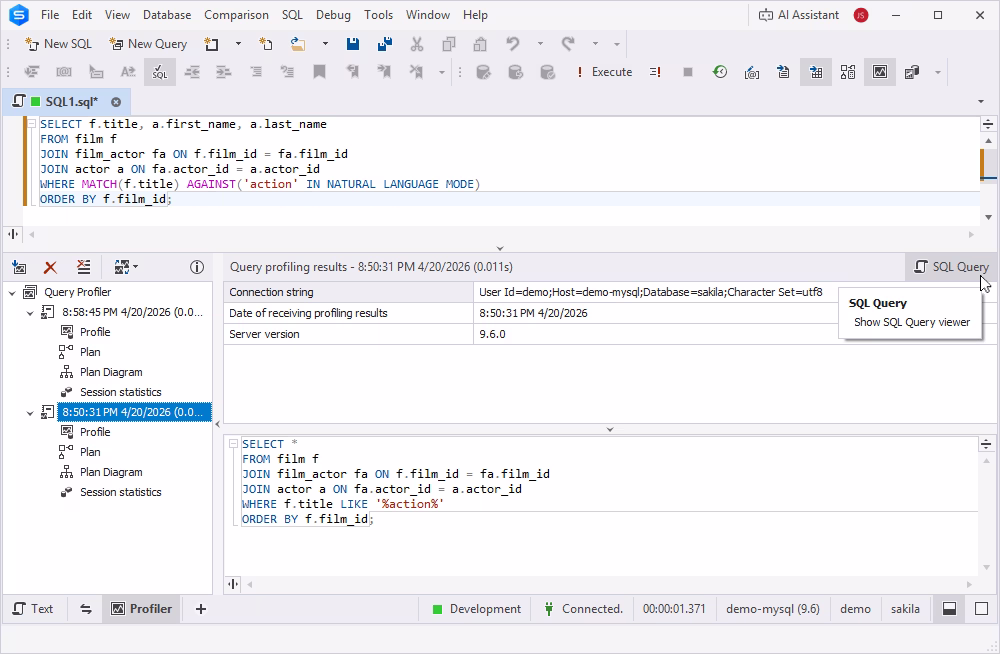
Display your query at any time
No need to copy a query text to a notepad after every change. dbForge's MySQL query profiling tool keeps
the query text along with its profiling results to let you optimize MySQL queries
effectively. Simply select a profiling result and click SQL Query.
With query changes history, you can return to any step of the query
optimization, review, execute, or save the query.
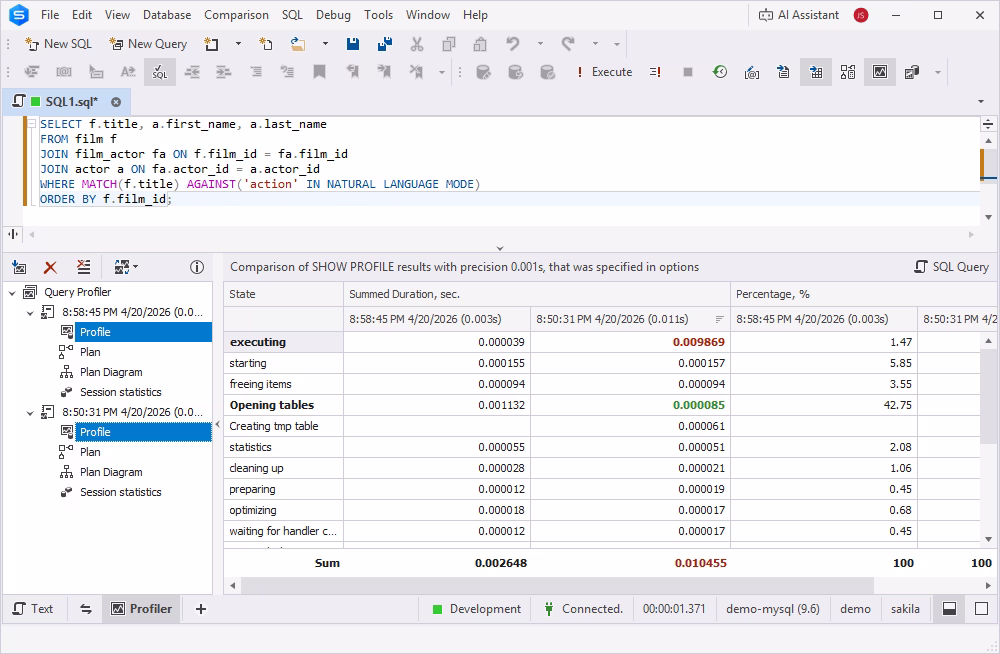
Compare query profiling results
The MySQL and MariaDB profiler integrated in dbForge Studio allows you to quickly optimize queries by comparing the differences in profiling
results immediately following your changes. Using Query Profiler, you can select results
for two query executions and get the differences highlighted in the grid. Again,
no copying and pasting into a notepad is required.
Why choose dbForge over other MySQL profiler tools?
dbForge MySQL Query Profiler stands out because it combines usability, visual clarity, and enterprise-grade capabilities in a single environment, rather than offering an isolated profiling utility.
Compared to MySQL Workbench, JetProfiler, or CLI-based tools, dbForge provides a more integrated and workflow-driven experience, combining features serving database management across the entire
lifecycle.
- Usability and productivity. dbForge Query Profiler offers a unified UI for analyzing query activity, monitoring performance patterns, and comparing optimization results. With no switching between interfaces, the tool enables clear,
interactive visualization of query performance, reducing the time required to resolve issues. For database developers and DBAs, this directly translates into
improved daily productivity.
- Visual output and analysis. In addition to text-based logs, MySQL profiler presents data in a structured, readable way: in a graphic diagram clearly identifying
improvement opportunities or a table comparing query performance metrics before and after optimization measures. This is especially valuable when profiling analysis is presented to
stakeholders not directly involved in SQL development.
- Enterprise readiness. For large environments, query profiling is not only about debugging and optimization—it is about improved governance and repeatability. dbForge's MySQL
query optimization tool is designed to support structured performance investigations, team workflows, and long-term performance monitoring strategies. With such capabilities, it is a
useful component of professional development environments valuing documentation and shared visibility.
- Integrated value. MySQL Query Profiler integrated in dbForge Studio for MySQL is not a standalone tool—it is part of a broader ecosystem that includes query development, data and schema comparison,
database administration, and performance optimization workflows. A unified interface supporting various tasks reduces context switching and allows performance analysis next to development activities.
Choose dbForge MySQL Query Profiler if you are looking for a clear and user-friendly UI, integrated workflows, enterprise-ready capabilities, and faster troubleshooting with minimized manual
interventions.
Supported platforms and compatibility
MySQL Query Profiler supports a variety of databases, allowing developers, administrators, and analysts to optimize queries against MySQL, MariaDB, Percona, HeatWave, Amazon RDS, and a number of
cloud databases. Compatible with both on-premises and cloud databases, Query Profiler provides a consistent experience across diverse database environments, enabling teams to use the same
diagnostic and optimization workflow regardless of the underlying platform.
Being a part of the rich feature set of dbForge Studio for MySQL, Query Profiler runs natively on Microsoft Windows version 7 and higher and Windows Server version 2008 and higher. However,
Linux and macOS users can also benefit from this MySQL profiler tool by installing it via CrossOver or Wine.
Conclusion
The MySQL query optimization tool available in dbForge Studio is designed to help database developers, DBAs, architects, and analysts achieve the optimal performance of MySQL and MariaDB databases, reduce time and
resource consumption, improve application speed, and increase the quality of data analysis.
Download dbForge Studio for MySQL for free to
get a hands-on experience of its rich functionality, including Query Profiler, and see the difference in your database performance and application productivity.
FAQ
How do I analyze slow queries in MySQL?
To analyze slow queries in MySQL, you can use dbForge MySQL Query Profiler, which provides a complete view of your query execution flow, indicating bottlenecks and suggesting improvements.
Can I optimize queries without indexing changes?
Yes. While missing indexes are a frequent cause of suboptimal query performance, there are other methods of its improvement:
- Remove redundant conditions
- Simplify complex expressions
- Eliminate unnecessary JOINs
- Break large queries into smaller, more targeted ones
What are common causes of slow MySQL queries?
MySQL query performance issues may be caused by a variety of reasons:
- Missing or inefficient indexes
- Poor query design (overly complex structures, redundant conditions, unnecessary JOINs, etc.)
- Large datasets
- Deadlocks
- High server load
How does query profiling help reduce server load?
Query profiling reduces server load by helping you identify exactly which queries consume the most resources—so you can optimize the real bottlenecks.
When you understand how queries behave under real workloads, you can cut unnecessary CPU usage, memory pressure, disk I/O, and locking—all of which directly impact server performance and scalability.
How to view the execution plan graphically in dbForge?
Query Profiler available in dbForge Studio for MySQL offers a highly informative query execution diagram that presents a graphical view of the query execution
hierarchy with all operations shown as individual nodes and optimization suggestions displayed for each identified issue. To view the query execution plan, open Query Profiler and run your
SQL query—the tool will build the EXPLAIN tree automatically.
Does dbForge support profiling for large datasets?
Yes. dbForge MySQL Query Profiler is designed to handle profiling in environments with large datasets and heavy workloads, making it suitable for production-level analysis and complex systems.