How to Optimize Query Performance Tuning in Oracle

Oracle SQL Profiler helps optimize SQL query performance in Oracle databases using the EXPLAIN execution plan and session statistics, as well as control resource allocation used to execute queries efficiently.

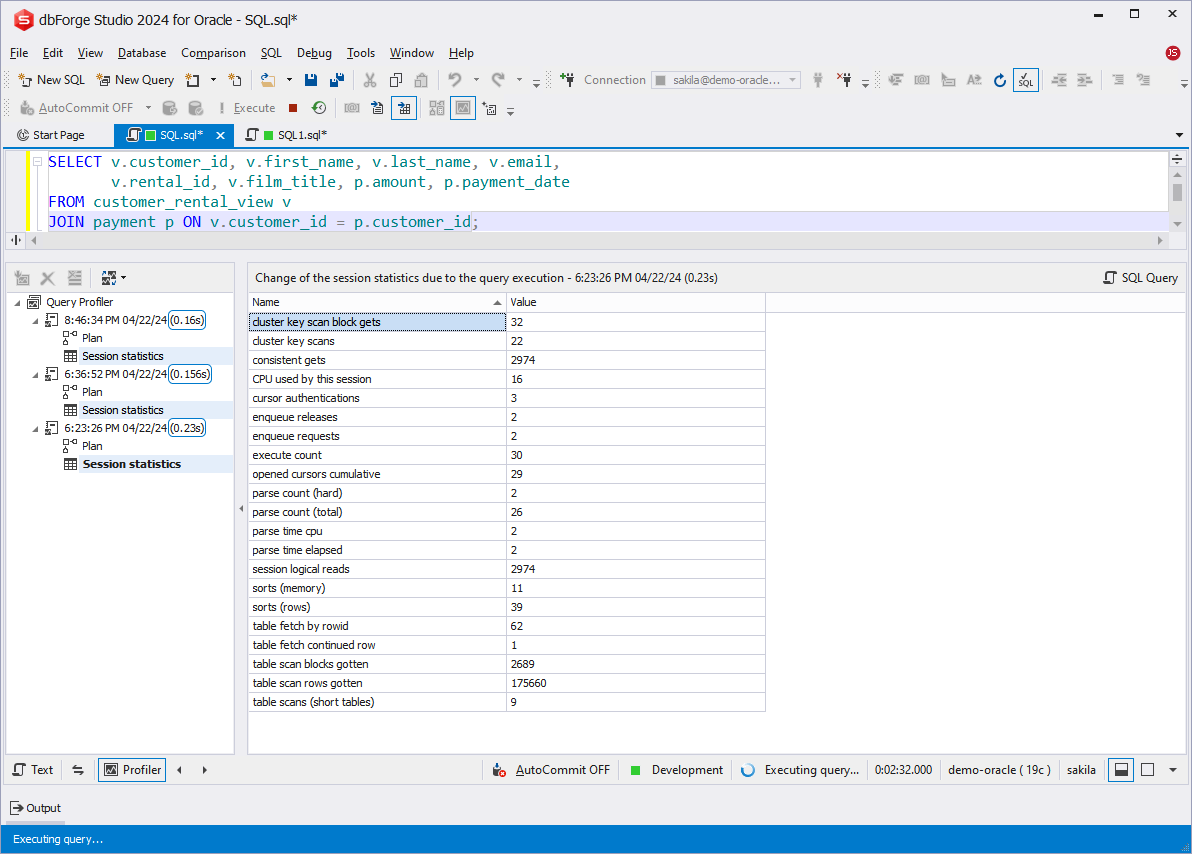
On this page, you can find out how to improve query tuning performance with dbForge Studio for Oracle on a particular example of an Oracle SQL query.

Slow-running queries can be time- and server resource-consuming. This may cause poor database performance and longer query execution and impact a client's application. Thus, it is critical to apply query optimization and performance tuning techniques to resolve performance issues promptly.

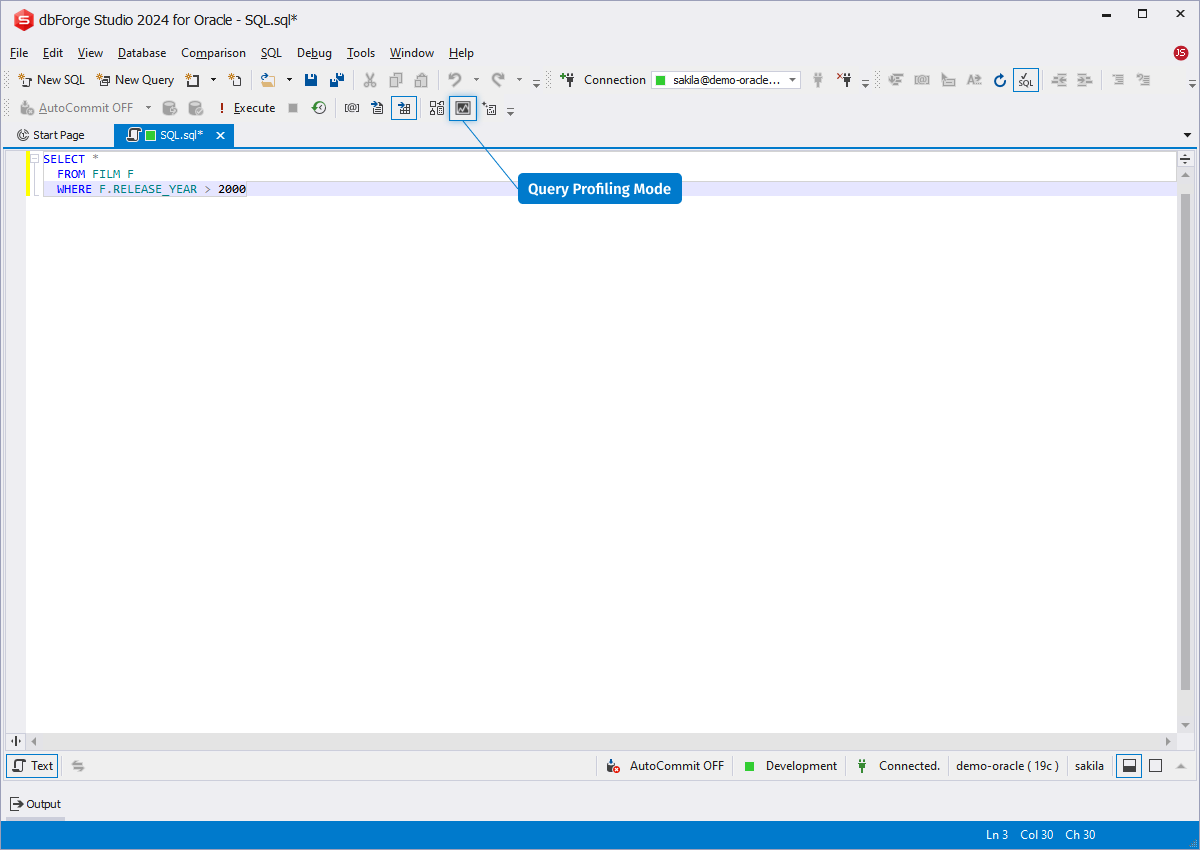
In dbForge Studio for Oracle, you can utilize Query Profiler, the ultimate query performance tuning and optimization tool that allows you to:

  • Examine causes for long-running queries and their poor performance
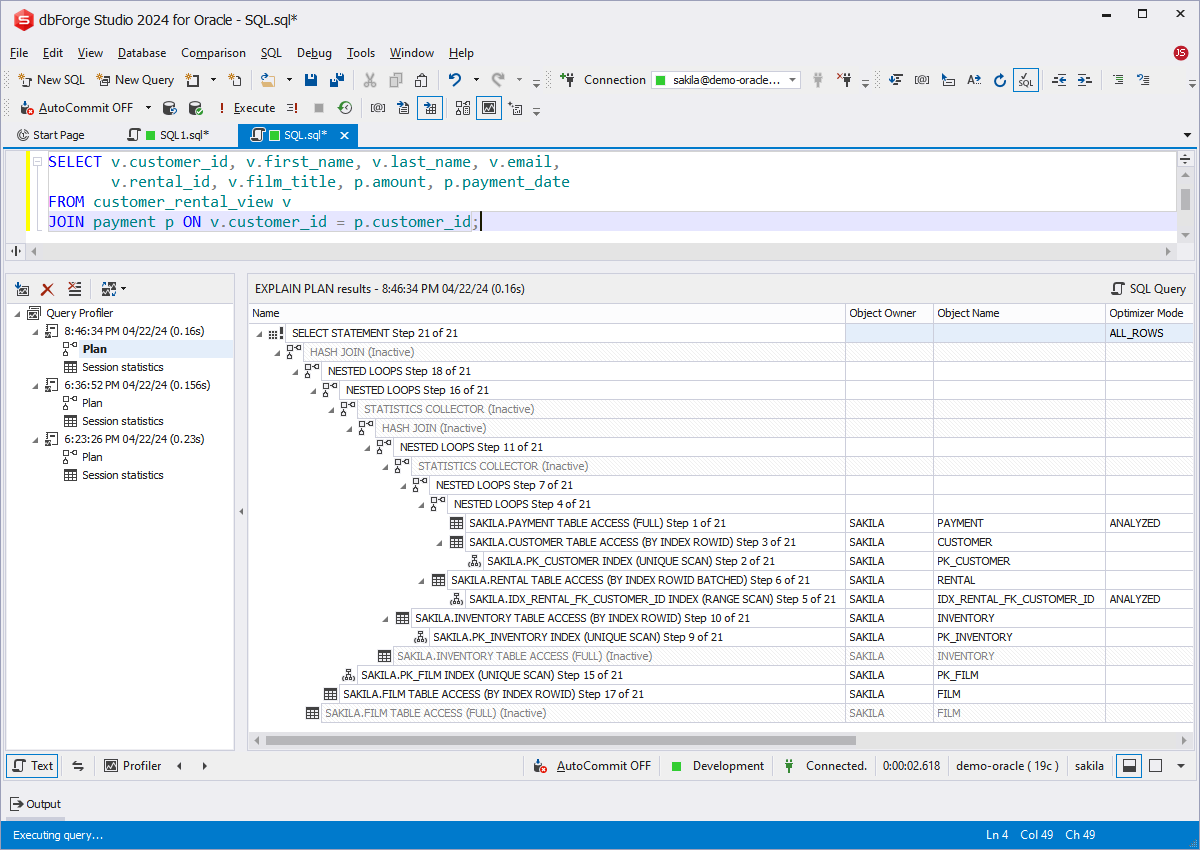
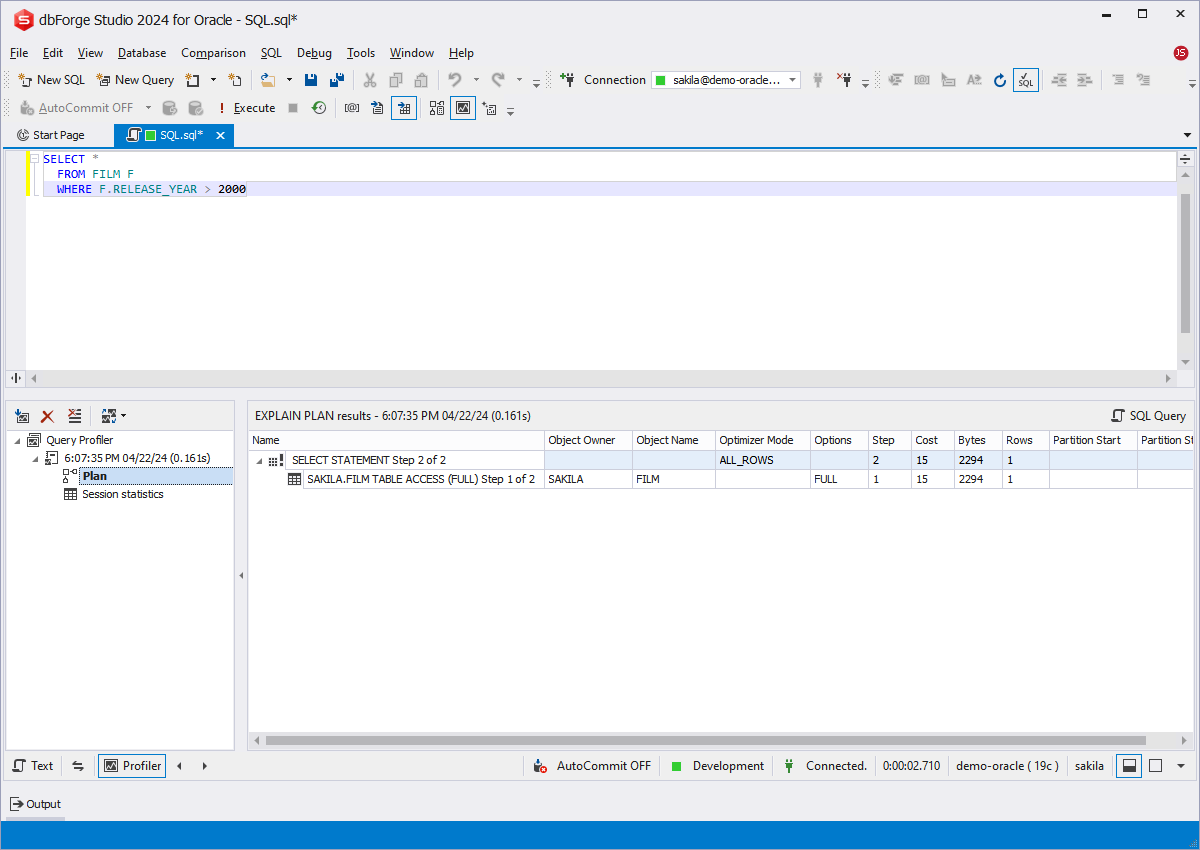
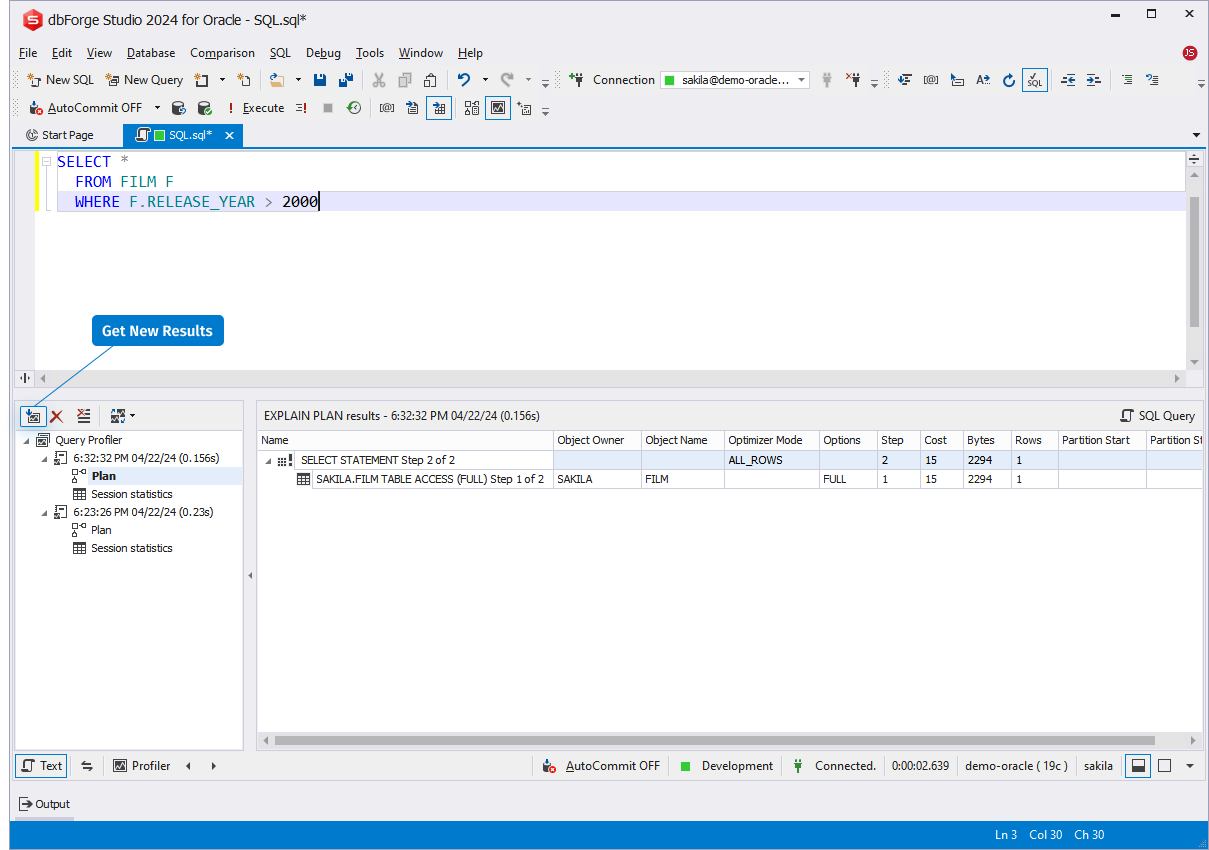
  • Monitor query performance using the Oracle EXPLAIN plan
  • Search for database bottlenecks and analyze their impact on the database performance
  • Manage increased loads a database
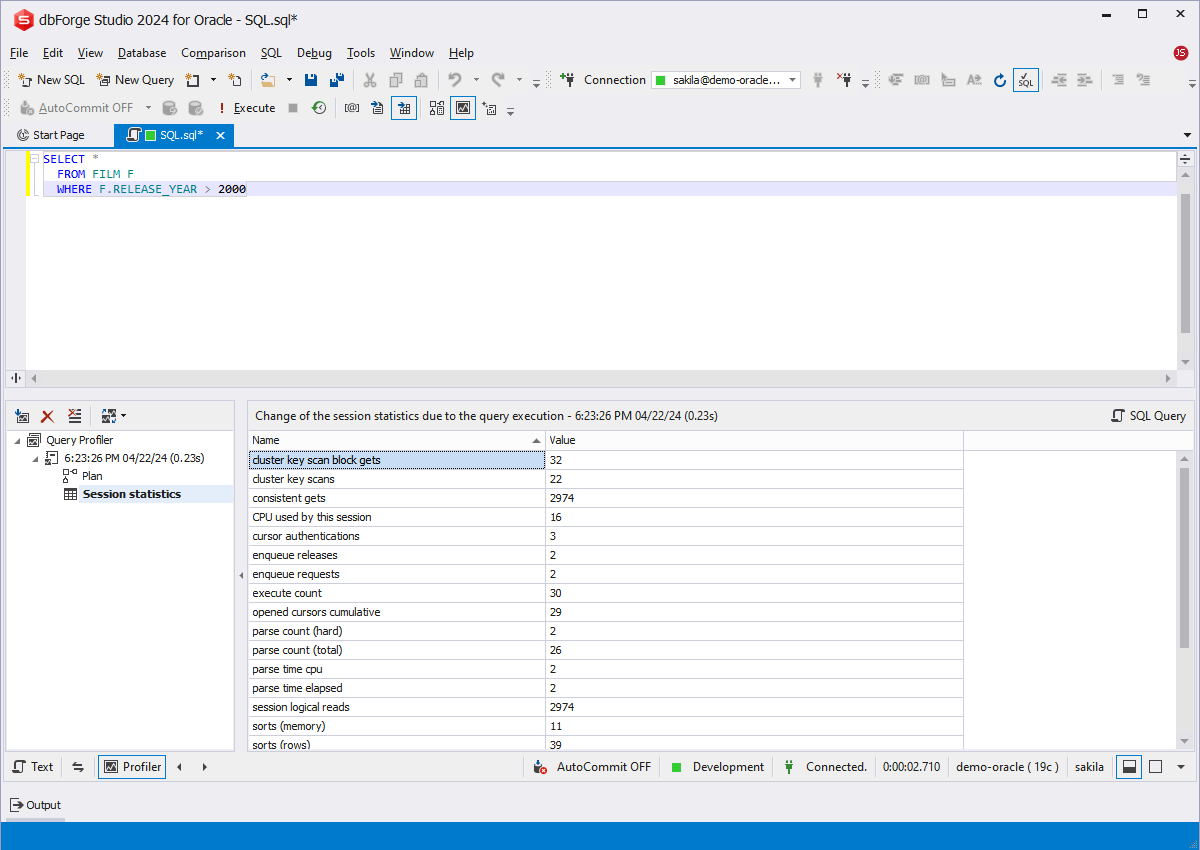
  • View query profiling results data to prevent possible issues with query slow performance
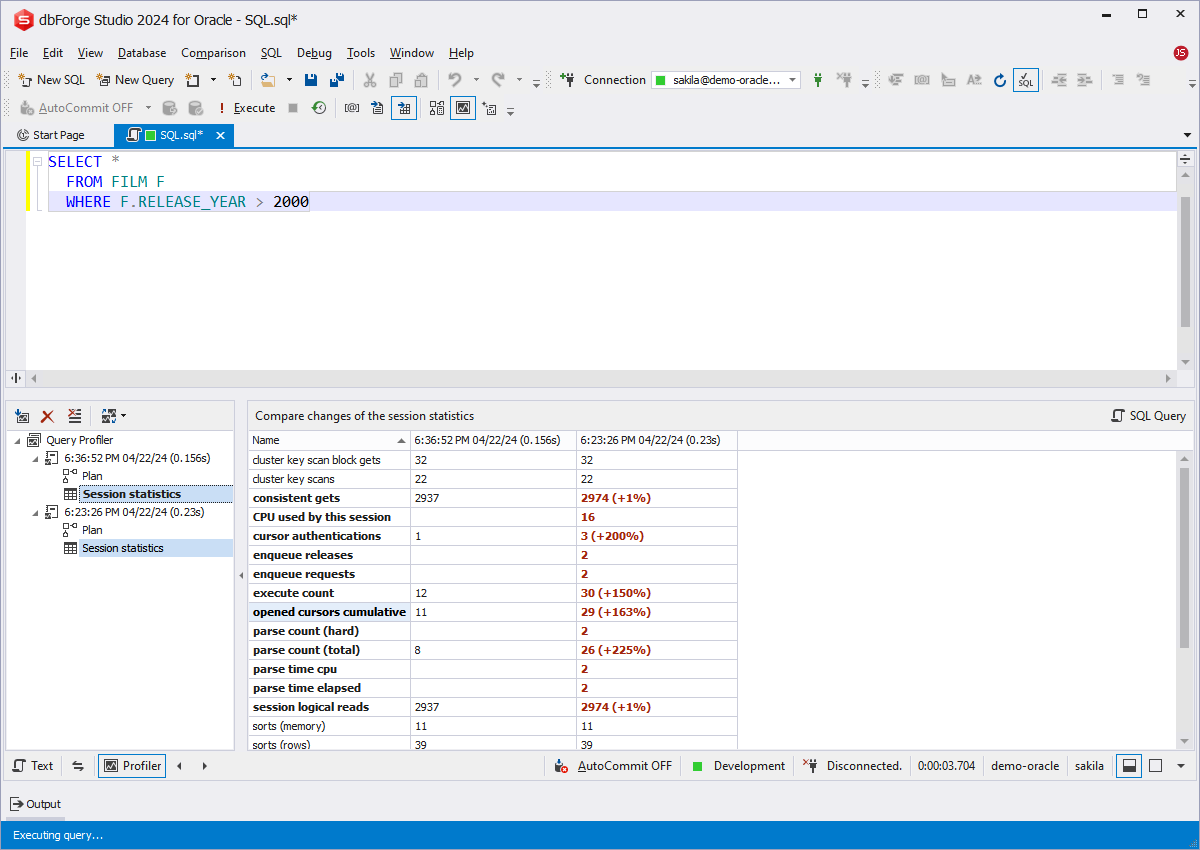
  • Compare query performance to identify what operations take more time and resources
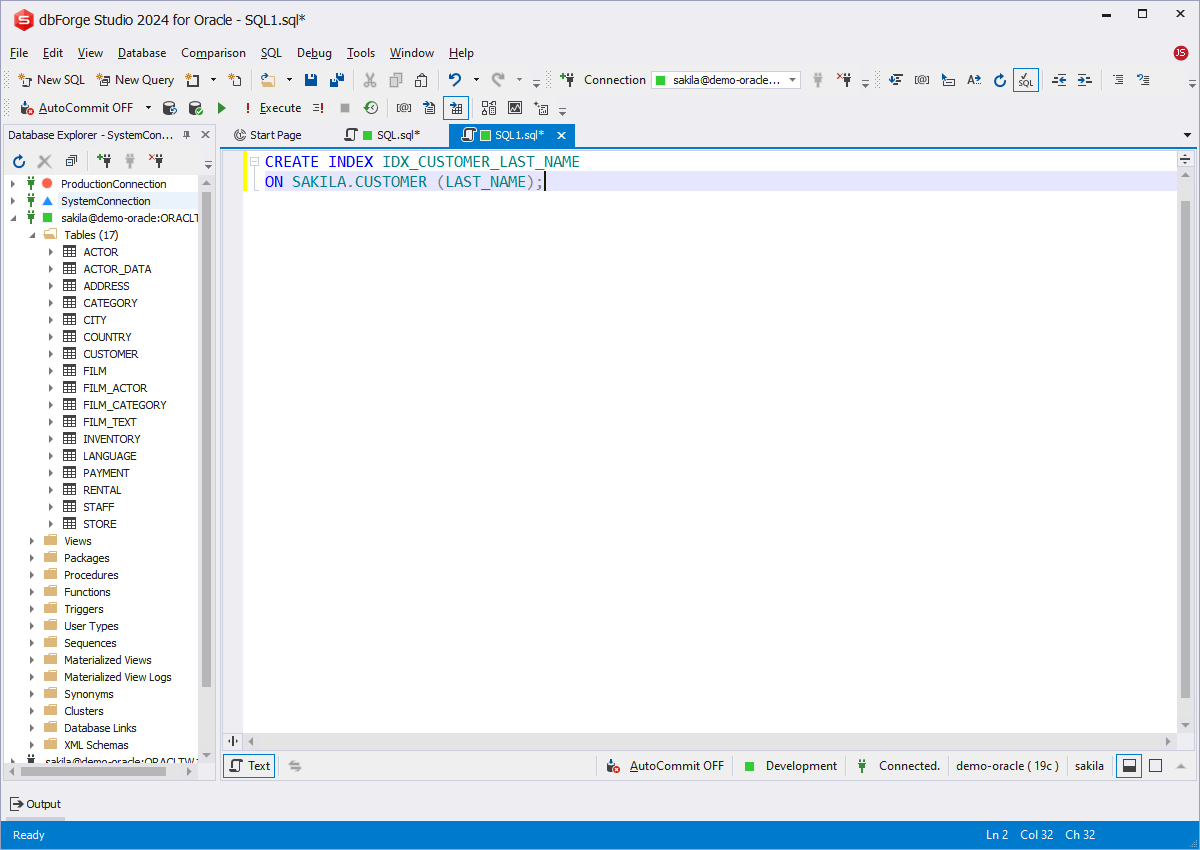
  • Decrease the database workload with the help of indexes

dbForge Studio for Oracle

Download a free 30-day trial of the multifunctional Oracle GUI

How to improve PL/SQL query performance in Oracle

There are several hints to improve query performance in Oracle:

  • Restructure indexes
  • Restructure the statement
  • Restructure data
  • Modify or disable triggers
  • Keep statistics in the relevant state and use the plan stability to have execution plans

dbForge Studio for Oracle comes with all the necessary utilities for quick and effective query efficiency optimization. It's compatible with the following Oracle versions: 8i, 9i, 10g, 11g, 12c, 18c, 19c, 21c.

Displaying query profiling results on the Oracle SQL Profiler tree

How to start Oracle query optimization with the profiling tool

To begin with, we create a query that returns records of the EMPLOYEEDEPARTMENTHISTORY table for employees
from certain regions defined by the NATIONALIDNUMBER
column of the EMPLOYEE table.

On the Standard toolbar, we click New SQL. In a SQL document that opens, we type the SELECT statement with WHERE.

To start tuning our query, we need to enable Query Profiling Mode on the SQL toolbar before executing the query.

How to enable a query profiling mode in dbForge Studio for Oracle

Check query performance in the Query Profiling mode

After the Query Profiling mode has been enabled, we can execute the query. The query profiling results are displayed as a grid in the Profiler mode where you can view and analyze what should be done and in what step to optimize query performance.

The Oracle SQL Profiler tree displays information in two tabs:

  • Plan that shows the EXPLAIN results returned by the SELECT executed query
  • Session statistics that show information on server resource utilization for each query execution
Displaying query profiling results on the Oracle SQL Profiler tree

Query performance analyzer

Assessing session statistics is critical for efficient query performance tuning in Oracle. It can help you identify server and database performance issues that may decrease overall performance.

The Oracle SQL Profiler tool collects and processes statistics on each query execution step for the current session. You can use this information to explore how many resources have been consumed by the query for the current connection.

How to analyze session statistics in an Oracle SQL Profiler tool

Create an index in Oracle for query performance optimization

Using indexes in SQL queries is an effective way to improve query performance, accelerate data retrieval operations, and reduce query response time. With the help of indexes, you can access and sort rows in the query much easier and faster.

Since we deal with a query containing a subquery, the performance is far from perfect. To make things better, we change the query by creating the index for the table in a SQL document.

How to create an index to optimize query performance in dbForge Studio for Oracle

Tune the query in Oracle using the EXPLAIN plan

After the index has been created, we profile our query again by simply clicking Get New Results on the Query Profiler document view. The Plan tab shows that now the query is executed with the created key.

The EXPLAIN plan allows you to view what has been checked on each step of query execution, including optimization approaches Oracle SQL query optimizer used, the number of rows processed, indexes to speed up the query, the amount of time (in units) it is expected to take to run the query, etc.

How to analyze Oracle Explain results plan

Queries performance comparison

To check if the changes have reduced query execution time, we can compare the profiling results of two queries.

To see the differences, we switch to the Session Statistics tab and, holding the Ctrl key, select the nodes of the required query profiling results in the Query Profiler tree. The differences will be highlighted on the grid with the date and time of query execution.

Comparing query profiling results of two queries using Oracle SQL query analyzer

Improve performance by creating views

To enhance query performance even better, we can create a view with the CREATE VIEW statement instead of the subquery (1).

Then, we will rewrite the query with the INNER JOIN statement (2).

Using views in SQL statements can significantly boost the execution of the statement, improve query response time, and help you investigate performance issues.

Creating a materialized view

Check results of query performance tuning

Now, it's time to get new results again and compare the performance of all three profiling results: without an index, with an index, and with a view.

The grid displays that the execution time and session statistics have been improved drastically: the query has become much faster and consumed fewer server resources.

Final Statistics Comparison

Conclusion

Oracle SQL Profiler is a powerful query optimization tool to fine-tune SQL queries. The tool allows you to easily check and analyze query performance in Oracle, quickly detect bottlenecks in query execution and troubleshoot database performance issues, as well as improve SQL query performance, and, therefore, optimize server resources.

In addition to query optimization and performance tuning capabilities, dbForge Studio for Oracle offers a lot of useful and powerful database development and management tools.

dbForge Studio for Oracle

Facilitate your routine database operations with the powerful IDE.
Download a free 30-day trial and use advanced tools to increase your productivity

Availability in the editions of dbForge Studio for Oracle

Feature
Enterprise
Professional
Standard
Express